Return Rate Analytics: Measure Returns and Cut the Avoidable Ones
 Sophie Andersson
·
·
7 min read
Sophie Andersson
·
·
7 min read

Returns are the part of e-commerce nobody likes to talk about. You celebrate the sale, the revenue lands in your dashboard, and then weeks later a chunk of it quietly walks back out the door. For a lot of stores, returns are a bigger leak than anything happening at checkout—and most of them barely measure it.
Here’s the thing: returns aren’t just a logistics headache. They’re a goldmine of data about what’s wrong with your products, your descriptions, and your expectations. The stores that treat returns as a signal instead of a cost end up with fewer of them.
In this guide, I’ll cover how to measure your return rate properly, the metrics that actually matter, and how to read return data to find the root causes you can fix.
Why Return Analytics Deserve a Seat at the Table
Let’s start with the money. A return doesn’t just cancel a sale—it costs you more than the sale was worth. You eat return shipping, processing labor, restocking, and often a markdown if the item can’t be resold at full price. A returned $60 order can easily cost you $20 in handling on top of the lost revenue.
That’s why return rate belongs on your dashboard next to conversion rate and average order value. A store with great conversion and a brutal return rate isn’t as healthy as it looks. Net revenue is what pays the bills, and returns sit right between gross and net.
How to Calculate Return Rate
The headline metric is simple:
Return Rate = Items Returned ÷ Items Sold × 100
But—and you knew there’d be a but—the basic version hides a lot. There are a few variations worth tracking, each answering a different question:
| Metric | What it tells you |
|---|---|
| Unit return rate | What share of items sold come back |
| Order return rate | What share of orders include a return |
| Revenue return rate | What share of revenue is refunded |
| Return rate by product | Which specific items get sent back |
| Return rate by reason | Why customers return things |
Unit and revenue return rate can tell very different stories. If your cheap items get returned constantly but your expensive ones rarely do, your unit rate looks scary while your revenue rate stays calm. Track both.
Capture the Return Reason — Always
If you do only one thing from this article, do this: make customers pick a reason when they start a return. This single field turns returns from a mystery into a diagnosis. A useful reason list usually includes:
- Wrong size or fit
- Didn’t match the description or photos
- Quality lower than expected
- Arrived damaged or defective
- Changed my mind
- Ordered multiple to choose from
- Arrived too late
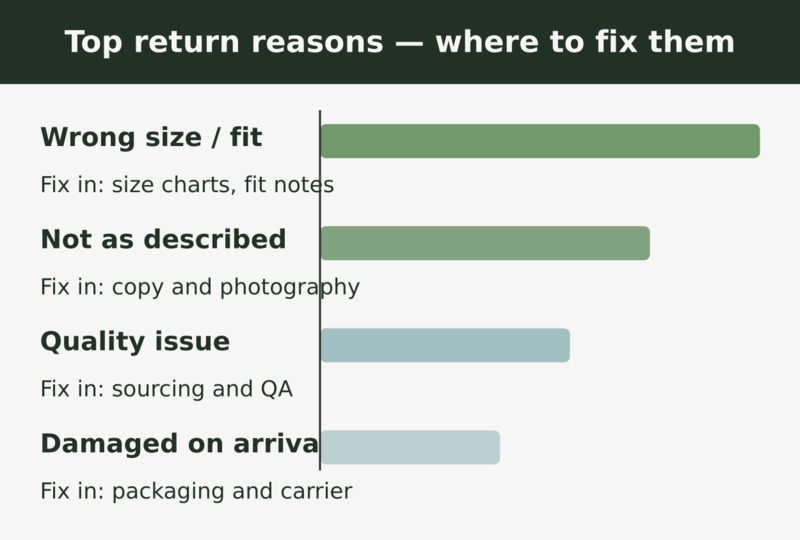
Each reason points to a different owner and a different fix. Watch how they map:
| Top reason | What it usually means | Where to fix it |
|---|---|---|
| Wrong size or fit | Sizing guidance is unclear | Size charts, fit notes, reviews |
| Didn’t match description | Expectations were oversold | Product copy and photography |
| Quality issues | Real product or supplier problem | Sourcing and QA |
| Damaged on arrival | Packaging or carrier handling | Packaging and shipping |
| Changed mind | Often impulse or unclear need | Better pre-purchase info |
See the pattern? Most return reasons trace back to a gap between what the customer expected and what showed up. Close that gap and returns fall. A lot of that gap lives on the product page—our product page optimization guide covers how to set accurate expectations before the order ever happens.
Find Your Problem Products
Returns are rarely spread evenly across your catalog. Usually a handful of products generate a disproportionate share. These are your problem children, and finding them is half the battle.
Sort your products by return rate and look at the worst offenders. For each one, ask:
- What’s the dominant return reason for this item?
- Are the photos and description accurate and complete?
- Is the sizing or spec information clear?
- Is this a quality issue we need to raise with the supplier?
Sometimes the fix is a better size chart. Sometimes it’s honest photography that stops overselling. And sometimes the honest answer is that a product is more trouble than it’s worth and should be retired. If you do pull a product, remember to redirect its page to a relevant alternative rather than leaving a dead link behind.
This naturally extends your product performance analysis—a high-return product might look like a winner on revenue until you account for everything coming back.
The Nuance: Not All Returns Are Bad
Here’s where it gets interesting. A generous return policy can actually increase sales. When shoppers know they can send something back easily, they’re more willing to buy in the first place—especially for higher-priced or fit-sensitive items.
So the goal isn’t zero returns. The goal is to eliminate the avoidable ones—returns caused by misleading descriptions, bad sizing info, or quality problems—while keeping the trust that a fair policy builds.
A return caused by a confusing size chart is a failure. A return caused by a customer trying on two sizes is just the cost of doing business.
This is also why “ordered multiple to choose from” deserves its own reason code. Those returns are baked into how some categories work, especially apparel. Lumping them in with quality complaints would point you at the wrong problem.
A Simple Return Review Routine
You don’t need a dedicated tool to start. A monthly review will surface most of the value:
- Calculate overall unit and revenue return rate for the month
- Break returns down by reason and watch the trend
- List your ten highest-return products
- For each, identify the dominant reason and the likely fix
- Separate avoidable returns from natural ones
- Pick two or three fixes and ship them
Then measure again next month. Like everything in analytics, the point isn’t the report—it’s the decision the report drives.
Frequently Asked Questions
What counts as a high return rate?
It varies enormously by category—apparel and footwear see far more returns than, say, electronics accessories. Rather than chasing a benchmark, compare your rate against your own history and against your other products. A product returning at double your store average is your signal.
Should I make returns harder to lower my return rate?
Usually no. Friction-heavy return policies tend to suppress sales and damage trust more than they save on returns. It’s better to remove the causes of avoidable returns than to punish customers for legitimate ones.
How is return rate different from refund rate?
They overlap but aren’t identical. A return involves goods coming back; a refund is money going out. A refund can happen without a physical return—say, for a damaged item you tell the customer to keep. Track both if you can.
Key Takeaways
- Returns sit between gross and net revenue—measure them like a core metric
- Track unit, order, and revenue return rates; they can tell different stories
- Always capture a return reason—it turns returns into a diagnosis
- A few problem products usually drive most returns; find and fix them first
- The goal isn’t zero returns—it’s eliminating the avoidable ones while keeping customer trust
Returns are where good stores get separated from great ones. Measure them honestly, read the reasons, and fix the gaps between what you promise and what you deliver. Do that, and the door stops swinging the wrong way quite so often.

Sophie Andersson
Technical marketer with 7+ years in e-commerce growth teams. Started as a developer, moved into marketing, and now lives at the intersection of both worlds. Believes that good analytics shouldn't require a PhD to understand.
More about me →