E-commerce A/B Testing: How to Run Experiments That Actually Improve Conversions

Here’s a frustrating truth about e-commerce A/B testing: most tests fail. Not because the ideas are bad, but because the execution is flawed. Teams launch tests without enough traffic, stop them too early, or test things that don’t actually matter. The result? A pile of inconclusive data and wasted effort.
But when done right, A/B testing becomes your most reliable growth lever. It’s the difference between guessing what your customers want and knowing what converts them. In this guide, I’ll walk you through everything you need to run e-commerce A/B tests that actually produce actionable results.
What Is A/B Testing (And Why Most E-commerce Teams Get It Wrong)?
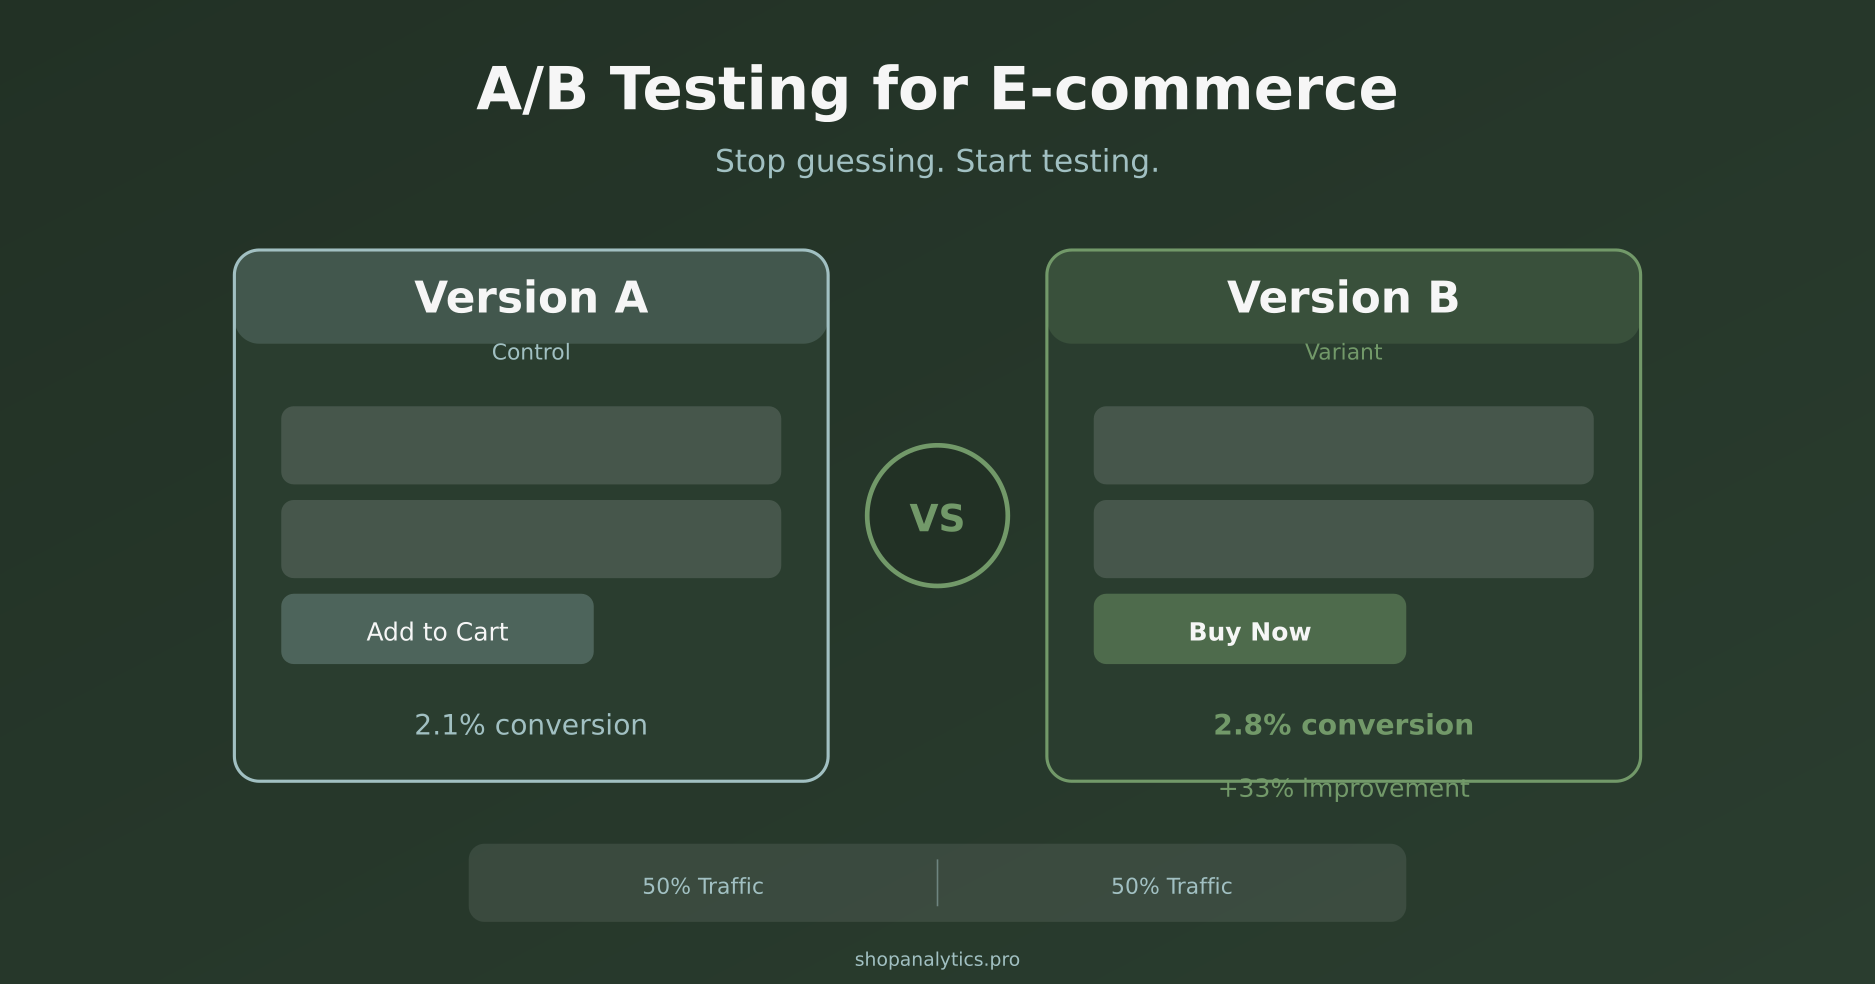
A/B testing—also called split testing—is simple in concept. You show two versions of something to different groups of visitors and measure which one performs better. Version A is your control (the current design). Version B is your variant (the change you’re testing).
The problem is that “simple in concept” doesn’t mean “easy to execute.” Here’s what typically goes wrong:
- Insufficient traffic — Testing with 500 visitors when you need 5,000
- Premature decisions — Calling a winner after three days because it “looks good”
- Random testing — No hypothesis, no prioritization, just “let’s try this”
- Wrong metrics — Optimizing for clicks when revenue is what matters
Consequently, teams end up with “winning” tests that don’t actually move the needle when rolled out to 100% of traffic. Sound familiar?
Why E-commerce A/B Testing Matters More Than Ever
In a world where customer acquisition costs keep climbing, conversion rate optimization through testing is one of the few levers that directly improves your unit economics. Consider this:
- A 10% improvement in conversion rate is equivalent to a 10% increase in traffic—without spending more on ads
- Small wins compound: five 5% improvements multiply to a 27.6% total lift
- Testing builds institutional knowledge about what your specific customers respond to
Moreover, A/B testing removes opinions from the conversation. Instead of debating whether the button should be green or orange in meetings, you let your customers decide with their wallets.
This connects directly to understanding your purchase intent signals. Testing helps you discover which elements actually influence buying decisions versus which ones you just think matter.
What Should You Test? The ICE Prioritization Framework
Not all tests are created equal. Testing your footer link color is technically A/B testing, but it won’t move your revenue. The key is prioritizing tests that have the highest potential impact.
I use the ICE framework to score every test idea before committing resources:
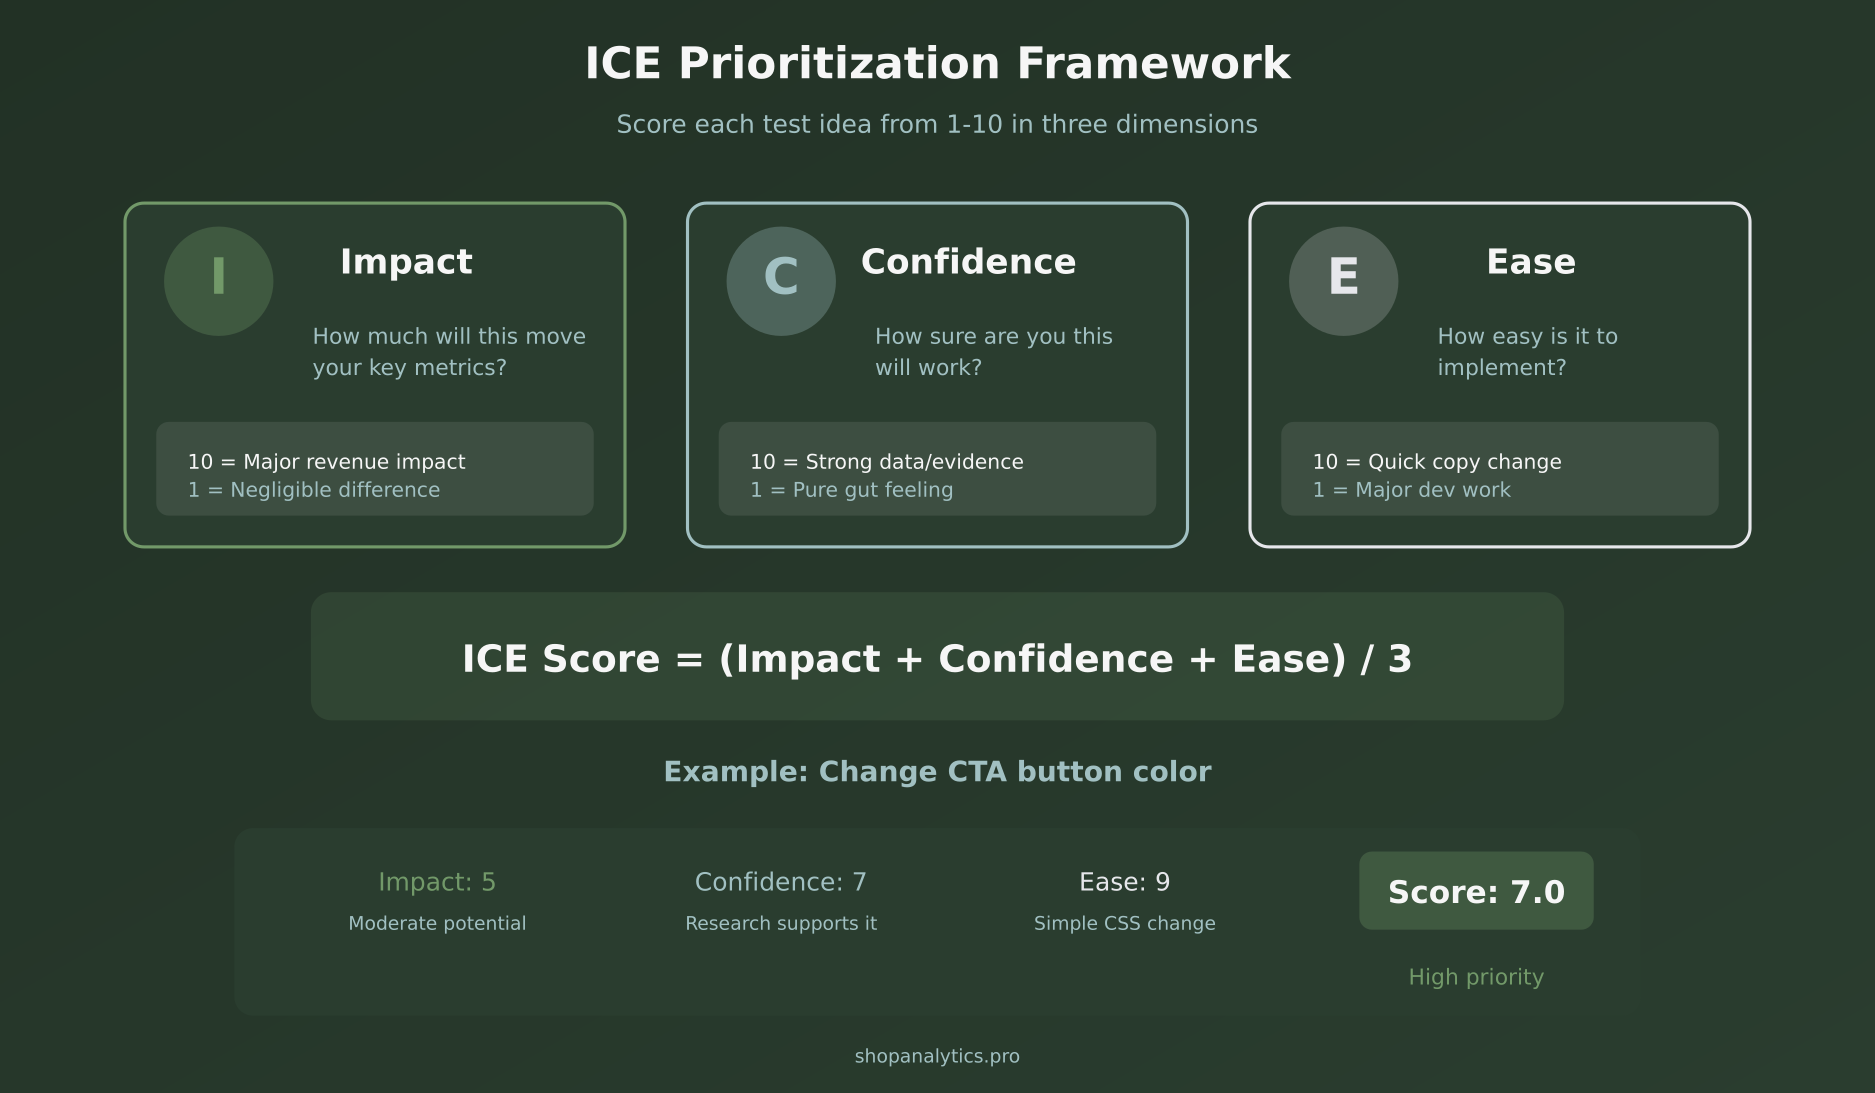
Impact (1-10): How much could this move your key metric? A checkout page change scores higher than a blog post layout change.
Confidence (1-10): How sure are you this will work? Based on user research, competitor analysis, or analytics data—not just gut feeling.
Ease (1-10): How simple is implementation? A copy change is easier than a complete page redesign.
Your ICE score = (Impact + Confidence + Ease) / 3. Tests scoring above 7 go first.
High-Impact Areas to Test First
Based on hundreds of e-commerce tests, here’s where you’ll typically find the biggest wins:
- Product pages — Image size, description format, social proof placement, add-to-cart button
- Cart page — Trust badges, shipping calculator, cross-sells, urgency elements
- Checkout flow — Guest checkout, form fields, payment options, progress indicators
- Homepage — Hero messaging, category navigation, featured products
- Collection pages — Filter options, sort defaults, products per row
If you’re struggling with cart abandonment, start there. That’s typically where the biggest revenue leaks happen.
The 6-Step A/B Testing Process
Running a proper A/B test isn’t complicated, but it does require discipline. Here’s the process I follow:
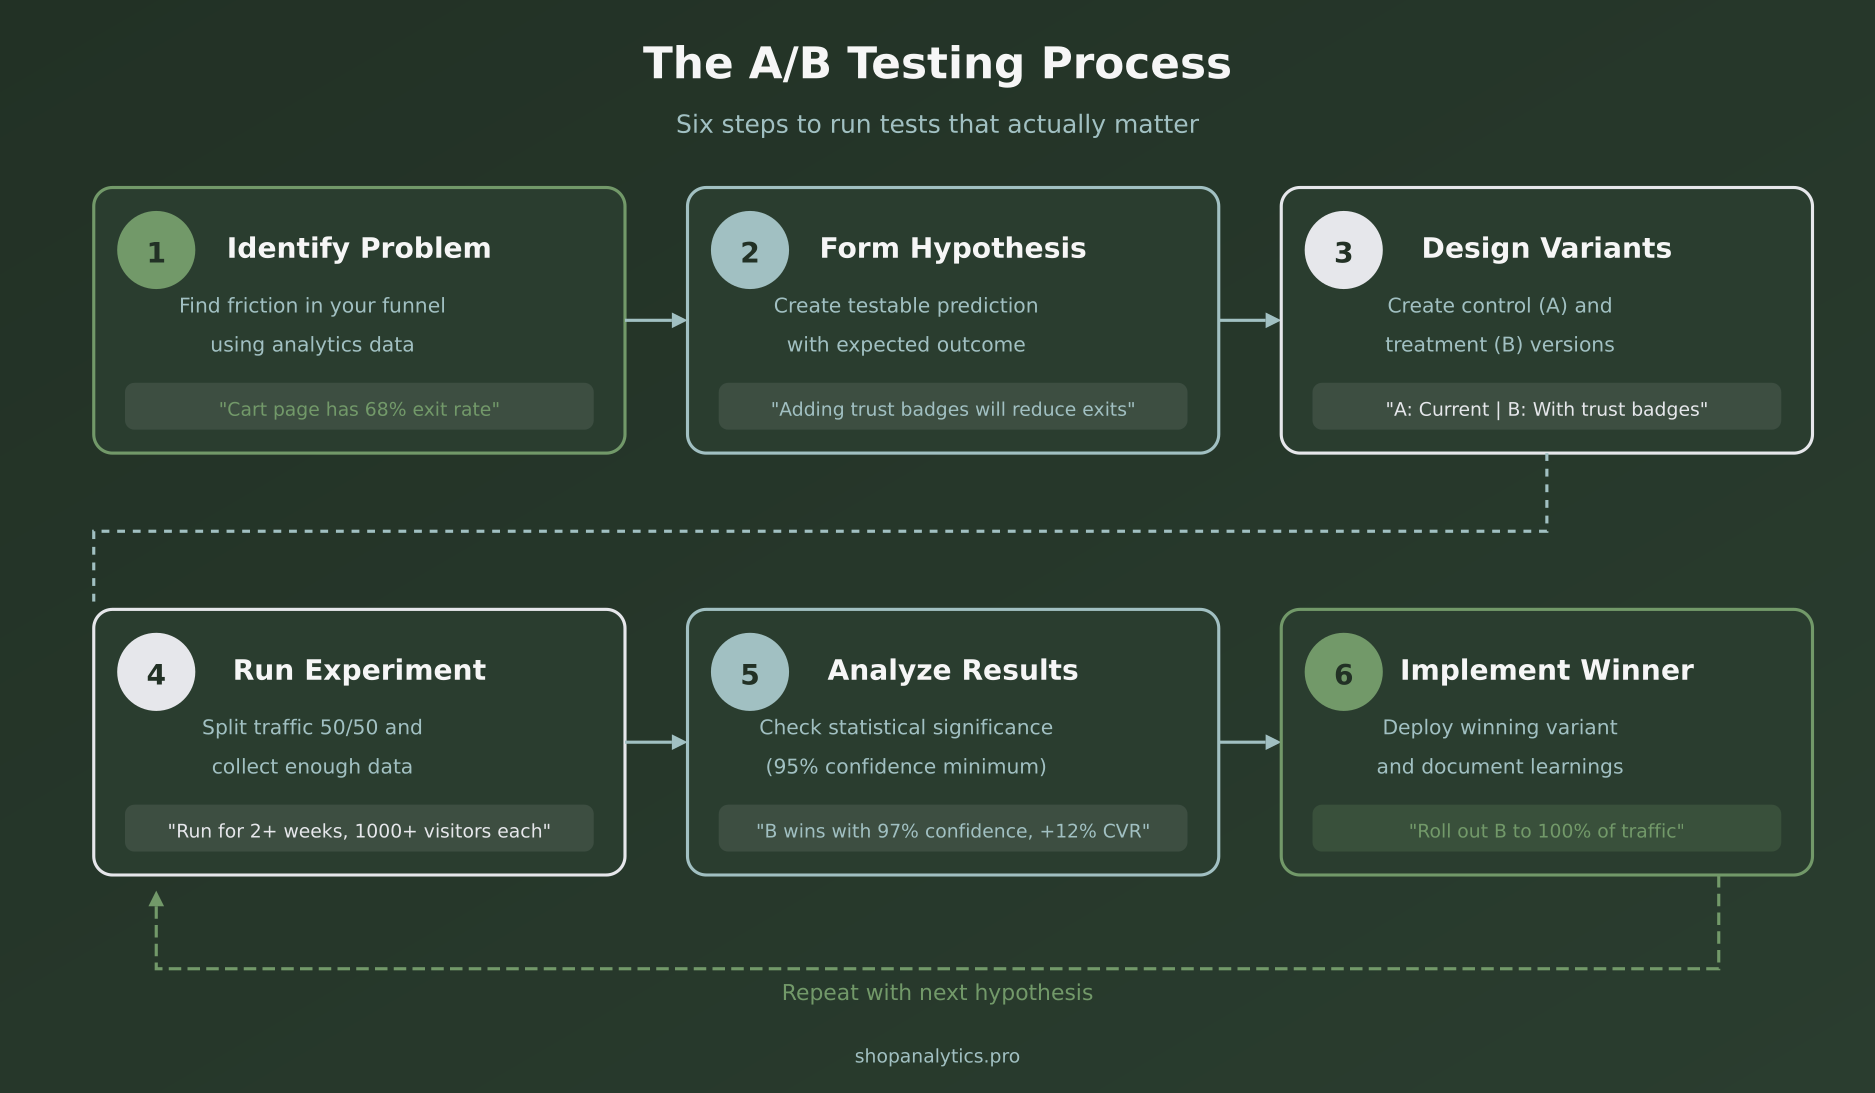
Step 1: Identify the Problem
Start with your analytics, not your opinions. Look for friction points in your funnel:
- Which pages have the highest exit rates?
- Where do people drop off in checkout?
- Which product pages have low add-to-cart rates despite good traffic?
Your analytics fundamentals should reveal these patterns. Additionally, heatmaps and session recordings can show you why people struggle.
Step 2: Form a Hypothesis
A good hypothesis follows this format:
“If we [change X], then [metric Y] will improve because [reason Z].”
For example: “If we add trust badges near the add-to-cart button, then our cart conversion rate will improve because customers will feel more confident about purchase security.”
The “because” part is crucial. It forces you to articulate why you think this will work, which helps you learn regardless of the test outcome.
Step 3: Design Your Variants
Keep it simple: one variable per test. If you change the button color AND the headline AND the image, you’ll never know which change caused the result.
There are exceptions—sometimes you want to test a completely different page design. But for most tests, isolated changes give you cleaner insights.
Step 4: Run the Experiment
Split your traffic 50/50 between control and variant. Let the test run until you hit statistical significance (more on this below) AND complete at least two full business cycles.
Critical: Don’t peek at results daily and get tempted to stop early. Set a duration upfront and stick to it.
Step 5: Analyze Results
Look beyond the headline number. Even if version B “wins,” dig into:
- Did it perform consistently across device types?
- How did new vs. returning visitors respond?
- Was there any impact on average order value or return rates?
A test might increase conversion rate but decrease AOV, resulting in net-zero revenue impact. Customer segmentation helps you understand these nuances.
Step 6: Implement and Document
If you have a winner, roll it out to 100% of traffic. Then document everything:
- What you tested and why
- The hypothesis and outcome
- Key learnings for future tests
This documentation becomes invaluable. After 20+ tests, you’ll have a playbook of what works specifically for your audience.
Understanding Statistical Significance
Here’s the thing: just because version B has a higher conversion rate doesn’t mean it’s actually better. Random chance can create apparent winners that disappear when you scale up.
Statistical significance tells you the probability that your results are real, not random noise.
The 95% Confidence Standard
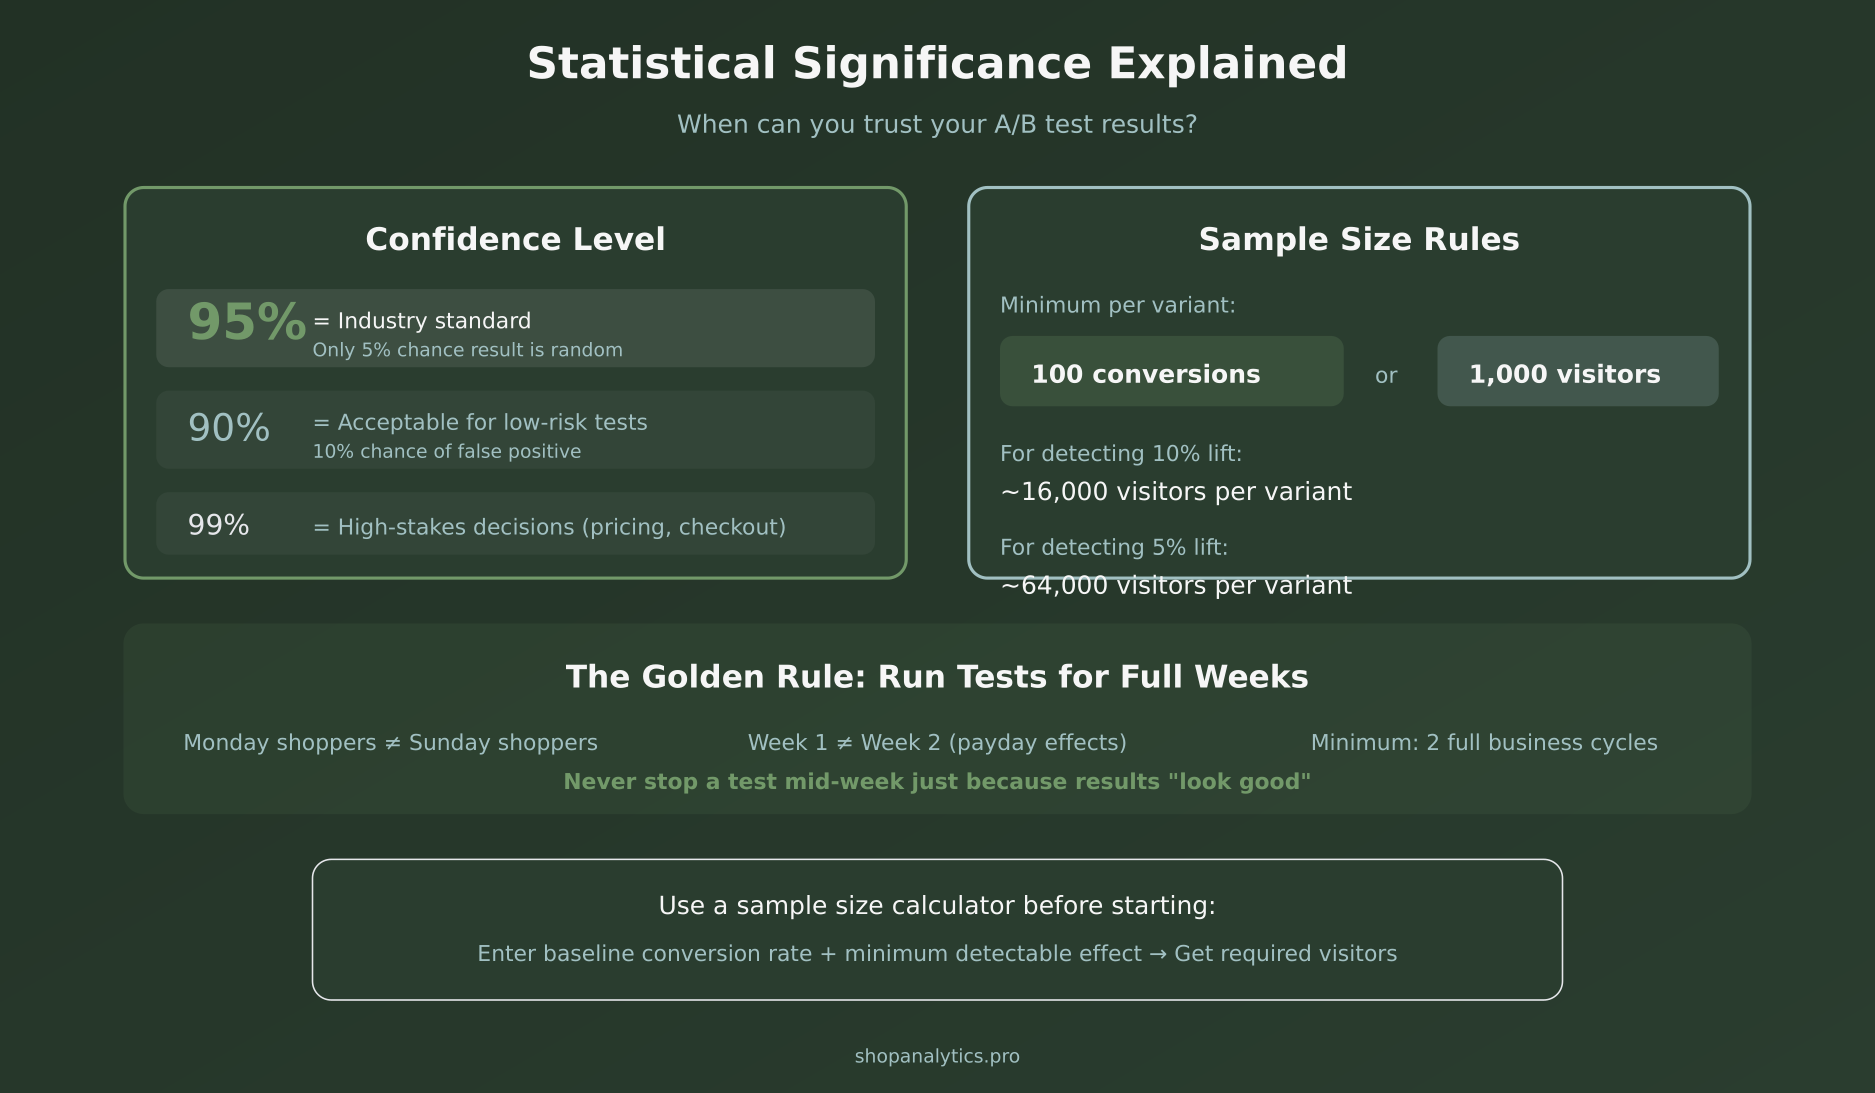
Industry standard is 95% confidence, meaning there’s only a 5% chance your result is a false positive. For high-stakes tests (pricing, checkout flow), consider 99%.
However, reaching 95% confidence requires adequate sample size. The smaller the lift you’re trying to detect, the more visitors you need:
- Detecting 20% lift: ~4,000 visitors per variant
- Detecting 10% lift: ~16,000 visitors per variant
- Detecting 5% lift: ~64,000 visitors per variant
These numbers vary based on your baseline conversion rate and confidence level. Use our sample size & MDE calculator to get exact requirements for your store. This is why many small stores struggle with A/B testing—they simply don’t have enough traffic to detect small improvements reliably.
The Full-Week Rule
Even with enough visitors, you should run tests for complete weeks. Why? Because customer behavior varies:
- Monday shoppers behave differently than Sunday shoppers
- Payday weeks differ from mid-month weeks
- Beginning-of-month vs. end-of-month patterns exist
As a rule of thumb, run tests for a minimum of two full weeks to capture these variations.
7 A/B Testing Mistakes That Destroy Your Results
After reviewing hundreds of e-commerce tests, these are the errors I see most frequently:
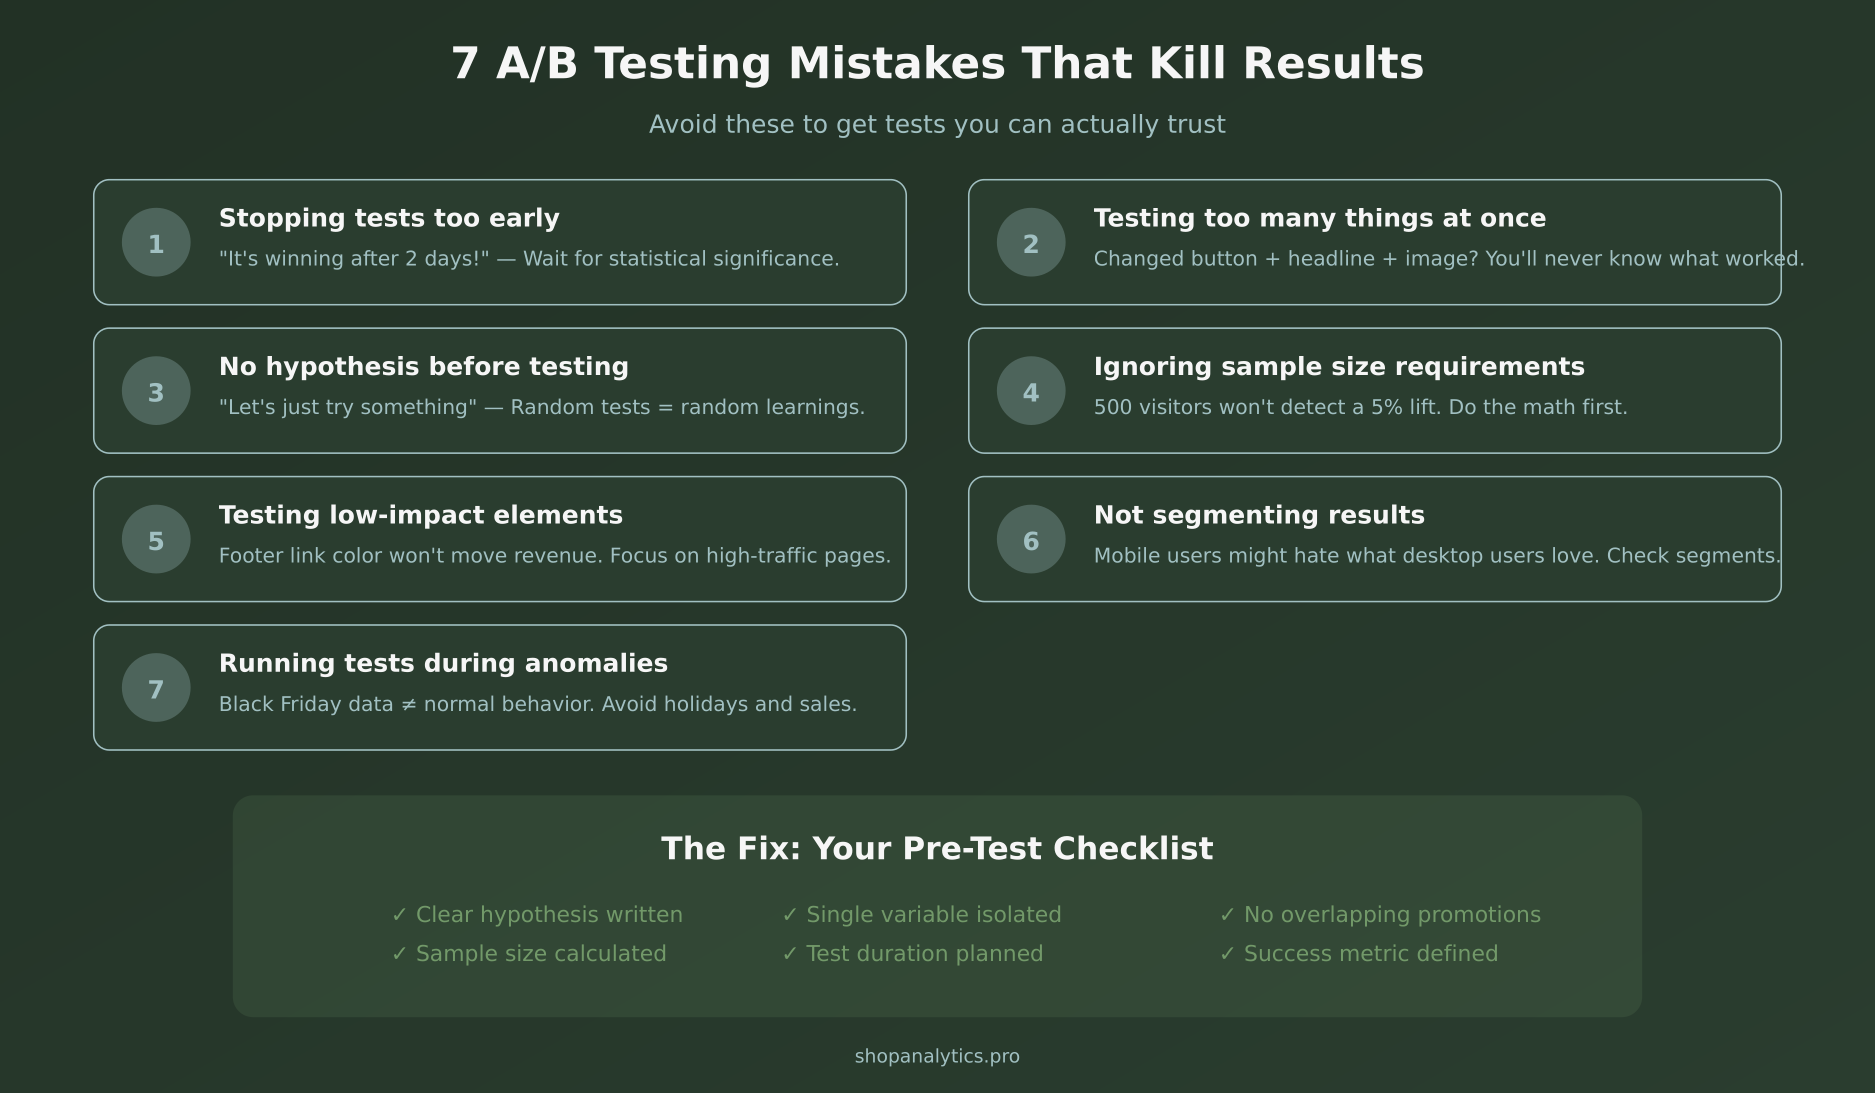
1. Stopping tests too early. “It’s winning by 15% after 3 days!” — Early results are notoriously unreliable. Wait for significance.
2. Testing too many variables. Changed button color, copy, and position? You’ll never isolate what worked.
3. No hypothesis. Testing without a clear “why” means you learn nothing even when you win.
4. Ignoring sample size. 500 visitors can’t detect a 5% improvement. Calculate requirements before starting.
5. Testing low-impact elements. Footer tweaks won’t move revenue. Focus on high-traffic, high-intent pages.
6. Not segmenting results. Your mobile users might hate what desktop users love. Always check segments.
7. Running tests during anomalies. Black Friday data isn’t representative. Avoid holidays, sales, and unusual traffic spikes.
E-commerce A/B Testing Tools
You don’t need expensive enterprise software to start testing. Here’s a quick overview of popular options:
Free/Low-cost:
- Google Optimize — Free, integrates with GA4, good for beginners (sunset but alternatives emerging)
- Shopify’s built-in A/B testing — Native for product pages if you’re on Shopify Plus
Mid-range:
- VWO — Visual editor, good for non-developers
- Convert — Privacy-focused, GDPR-compliant
- AB Tasty — Strong personalization features
Enterprise:
- Optimizely — Full-featured, server-side testing, expensive
- Dynamic Yield — Advanced personalization + testing
For most e-commerce stores, VWO or a similar mid-range tool provides the best balance of features and cost.
Setting Up Your First Test: A Quick Checklist
Ready to run your first test? Make sure you have proper event tracking in place first. Then follow this checklist:
- ☐ Problem identified from analytics data
- ☐ Hypothesis written (If X, then Y, because Z)
- ☐ Single variable isolated
- ☐ Sample size calculated (use our sample size & MDE calculator)
- ☐ Test duration set (minimum 2 weeks)
- ☐ Success metric defined (conversion rate? revenue? AOV?)
- ☐ No conflicting tests running
- ☐ No promotions or holidays during test period
- ☐ QA completed on both variants
What If You Don’t Have Enough Traffic?
Small stores often can’t reach statistical significance within reasonable timeframes. Here are your options:
Test bigger changes. A radical redesign is easier to detect than a subtle copy tweak. If you can’t detect 5% lifts, test for 30%+ improvements.
Focus on high-traffic pages. Your homepage and top product pages accumulate visitors faster than deep category pages.
Use qualitative methods. When you can’t run proper tests, combine user testing, surveys, and heatmaps to inform decisions. It’s not as rigorous, but it’s better than guessing.
Accept longer test durations. A test that takes 8 weeks is still better than no test at all.
Understanding your micro-conversions can also help—these intermediate metrics often have higher event volumes than final purchases.
Frequently Asked Questions
How long should an A/B test run?
At minimum, two full weeks to account for day-of-week variations. Ideally, until you reach 95% statistical significance with at least 100 conversions per variant.
Can I run multiple A/B tests at the same time?
Yes, but only if they don’t overlap. Testing checkout AND product pages simultaneously is fine because different visitors are affected. Testing two things on the same page is problematic.
What’s a good conversion rate improvement to aim for?
Realistically, most winning tests produce 5-15% improvements. Claims of 50%+ lifts are usually flukes or poorly designed tests. Aim for consistent small wins rather than home runs.
Should I test on mobile and desktop separately?
Not necessarily separately, but always segment your results by device. What works on desktop might fail on mobile due to different user contexts and interface constraints.
Key Takeaways
- Prioritize ruthlessly — Use ICE scoring to focus on high-impact tests
- Start with a hypothesis — “If X, then Y, because Z” forces clear thinking
- Wait for significance — 95% confidence minimum, no peeking
- Run full weeks — Customer behavior varies by day and week
- Isolate variables — One change per test for clear learnings
- Document everything — Build institutional knowledge over time
- Segment results — Overall wins can hide segment-specific losses
A/B testing isn’t about finding magic bullets. It’s about systematic improvement—learning what your customers respond to and compounding those wins over time. Start with one test this week. Make it count.
Sophie Andersson
Technical marketer with 7+ years in e-commerce growth teams. Started as a developer, moved into marketing, and now lives at the intersection of both worlds. Believes that good analytics shouldn't require a PhD to understand.
More about me →