Average Order Value: How to Measure It and 7 Ways to Raise It
 Sophie Andersson
·
·
8 min read
Sophie Andersson
·
·
8 min read

Here’s a question I ask every store owner I work with: what does an average order on your site look like? Most of them know their conversion rate cold. They can quote their traffic numbers from memory. But when it comes to how much a typical customer actually spends, things get fuzzy.
That’s a problem. Because average order value—AOV for short—is one of the few levers you can pull that doesn’t require a single extra visitor. You already paid to get people to your store. The question is whether you’re getting everything you can out of each order.
In this guide, I’ll break down what average order value actually measures, how to calculate it properly, and the practical ways to move it up without resorting to gimmicks that annoy customers.
What Is Average Order Value?
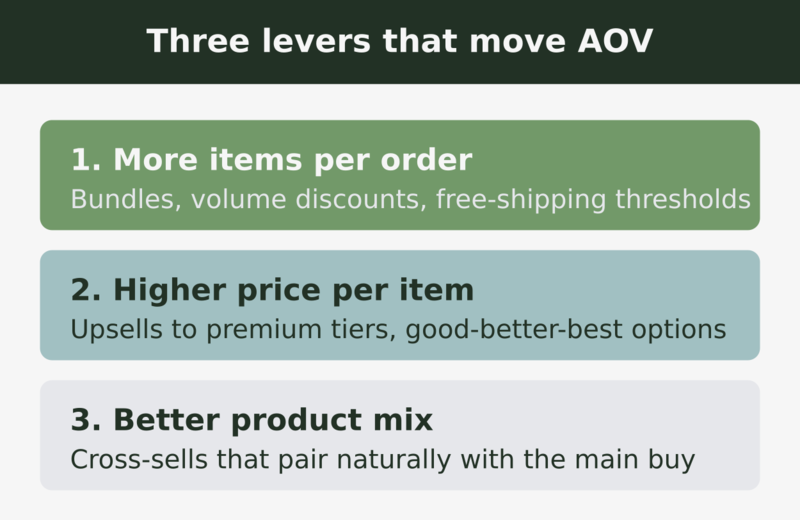
Average order value is the mean amount a customer spends in a single transaction. The formula is refreshingly simple:
AOV = Total Revenue ÷ Number of Orders
So if your store made $50,000 across 1,000 orders last month, your AOV is $50. That’s it. No PhD required.
But here’s the thing: that single number hides a lot. A $50 average could mean every customer spends almost exactly $50, or it could mean half spend $20 and half spend $80. Those are very different stores, and they need very different strategies. We’ll get to that.
Why AOV Matters More Than You Think
Revenue in e-commerce comes down to three numbers multiplied together:
Revenue = Traffic × Conversion Rate × Average Order Value
Most teams obsess over the first two. They pour money into ads to grow traffic. They run endless tests to nudge conversion rate. Both are valuable—our guide on e-commerce A/B testing covers the conversion side in depth. But AOV often gets ignored, and that’s a mistake.
Why? Because raising AOV is frequently the cheapest growth lever you have. Consider the math:
- Growing traffic costs money—more ad spend, more content, more outreach
- Improving conversion rate takes time—testing, iteration, design work
- Raising AOV often just means a smarter checkout flow or a better product recommendation
A 10% lift in AOV flows straight to your revenue. And because you’re not spending more on acquisition, much of it flows to your profit too. That’s why it deserves a permanent spot on your dashboard.
AOV and Customer Lifetime Value
AOV is also a building block for a bigger number: customer lifetime value. If you know your average order is $50, your customers buy three times a year on average, and they stick around for two years, you’ve got a rough lifetime value of $300.
This matters for one big reason: it tells you how much you can afford to spend acquiring a customer. If a customer is worth $300 over their lifetime, paying $40 to acquire them is a no-brainer. If your AOV is $20 and people buy once, $40 acquisition cost is a fast track to bankruptcy.
So AOV isn’t just a vanity metric. It anchors your entire acquisition economics.
How to Calculate AOV Correctly
The basic formula is simple, but there are a few traps worth flagging.
Use revenue, not gross sales
Decide whether you want AOV before or after discounts, shipping, and taxes. Most analysts use net product revenue—what the customer paid for goods, minus discounts, excluding shipping and tax. The important thing is to pick one definition and stay consistent. Comparing a gross-sales AOV from one month against a net AOV from another will give you nonsense.
Watch for outliers
One enormous wholesale order can drag your average way up and hide what’s happening with normal customers. When that’s a risk, look at the median order value alongside the mean. If your mean is $80 but your median is $45, you’ve got a handful of big orders skewing the picture.
Segment before you conclude
A blended AOV across your whole store can be misleading. New customers usually spend less than returning ones. Mobile shoppers often spend less than desktop. Calculate AOV by segment and you’ll find where the real opportunities live. This pairs naturally with behavioral customer segmentation—different segments behave differently, and AOV is one of the clearest ways to see it.
A Quick AOV Benchmark Table
People always ask what a “good” AOV is. Honestly, it depends entirely on what you sell. A fashion boutique and a furniture store live in different universes. Instead of chasing an industry number, compare yourself against your own past performance and your gross margin. Here’s a rough way to think about where your AOV sits relative to your goals:
| Signal | What it suggests | What to do |
|---|---|---|
| AOV well below your margin needs | Each order barely covers acquisition cost | Prioritize order-value tactics urgently |
| AOV flat for many months | You’ve optimized conversion but not basket size | Test bundles and thresholds |
| AOV rising but conversion falling | Pricing or upsells may be scaring buyers off | Find the balance point with testing |
| Mean far above median | A few large orders are distorting the average | Track median; segment the big buyers |
7 Practical Ways to Increase Average Order Value
Now for the fun part. Here are the tactics that consistently move AOV, roughly in order of how easy they are to implement.
1. Free shipping thresholds
“Add $12 more for free shipping” is one of the most reliable AOV boosters in e-commerce. Set the threshold roughly 20-30% above your current AOV. Set it too high and people give up; too low and you give away shipping you’d have earned anyway.
2. Product bundles
Group items that naturally go together and offer a small discount versus buying separately. A camera with a case and a memory card. A skincare routine instead of a single product. Bundles raise order value and reduce decision fatigue at the same time.
3. Smart upsells and cross-sells
An upsell offers a better version of what they’re buying; a cross-sell suggests a complementary item. The key word is relevant. Recommending winter gloves to someone buying a winter coat works. Recommending random bestsellers does not. Place these on the product page and in the cart, where intent is highest.
4. Volume and tiered discounts
“Buy 2, get 10% off. Buy 3, get 15% off.” This works especially well for consumables and gifts. You trade a little margin for a meaningfully bigger basket.
5. Gift wrapping and add-on services
Small paid extras—gift wrap, express handling, an extended warranty—add a few dollars per order with almost no downside. They also improve the experience for the right shoppers.
6. Minimum-order incentives
A gift with purchase over a certain amount, or a coupon unlocked at a spending threshold, nudges shoppers to add one more item. Frame it as something they earn, not something they’re being upsold.
7. Loyalty points that reward bigger baskets
If your loyalty program gives points per dollar spent, customers chasing a reward tier naturally spend more. It’s a slower lever, but it compounds over time and improves retention as a bonus.
Mistakes to Avoid
A few warnings before you go all-in on AOV.
Don’t chase AOV at the expense of conversion. If your upsells and thresholds make checkout feel like a used-car lot, people will leave. A higher AOV on fewer orders can mean lower total revenue. Always watch both numbers together.
Don’t bundle junk. Padding a bundle with products nobody wants doesn’t fool anyone. The bundle has to feel like genuine value, or it backfires.
Don’t ignore margin. Raising AOV with deep discounts can hurt profit even as revenue climbs. Track AOV and gross margin side by side.
As the marketing maxim goes:
It is far cheaper to sell more to an existing buyer than to find a brand-new one.
Frequently Asked Questions
Is a higher AOV always better?
Not necessarily. A higher AOV is only good if it doesn’t come with a drop in conversion rate or margin. The goal is more total profit, not a bigger number on a slide.
How often should I check AOV?
Monthly is fine for trends. Check it again whenever you launch a campaign, change pricing, or run a promotion, since those things move it directly.
Should I include shipping in AOV?
Most analysts exclude shipping and tax and use net product revenue. Whatever you choose, stay consistent so your trend line means something.
Key Takeaways
- AOV = total revenue ÷ number of orders—simple, but it hides a lot, so segment it
- It’s often the cheapest growth lever because it needs no extra traffic
- Watch the median alongside the mean to catch outliers
- Free shipping thresholds, bundles, and relevant upsells are the most reliable boosters
- Never raise AOV at the cost of conversion rate or margin—track all three together
Average order value is the quiet metric that rewards stores willing to look past traffic and conversion. Get it right, and you grow revenue from the customers you already worked so hard to win.

Sophie Andersson
Technical marketer with 7+ years in e-commerce growth teams. Started as a developer, moved into marketing, and now lives at the intersection of both worlds. Believes that good analytics shouldn't require a PhD to understand.
More about me →