Product Performance Analysis: Find Your Winners and Dead Weight
 Sophie Andersson
·
·
7 min read
Sophie Andersson
·
·
7 min read

Most store owners can name their bestseller without thinking. But ask them which products quietly lose money, which categories punch above their weight, or which items sit in the catalog gathering digital dust—and the room goes quiet.
That’s the gap product performance analysis fills. It’s the discipline of looking at your catalog the way an investor looks at a portfolio: which products earn, which drag, and where to put your attention next.
In this guide, I’ll show you which metrics actually matter at the product and category level, how to spot your hidden winners and dead weight, and what to do once you know.
Why Product-Level Analysis Beats Store-Level Numbers
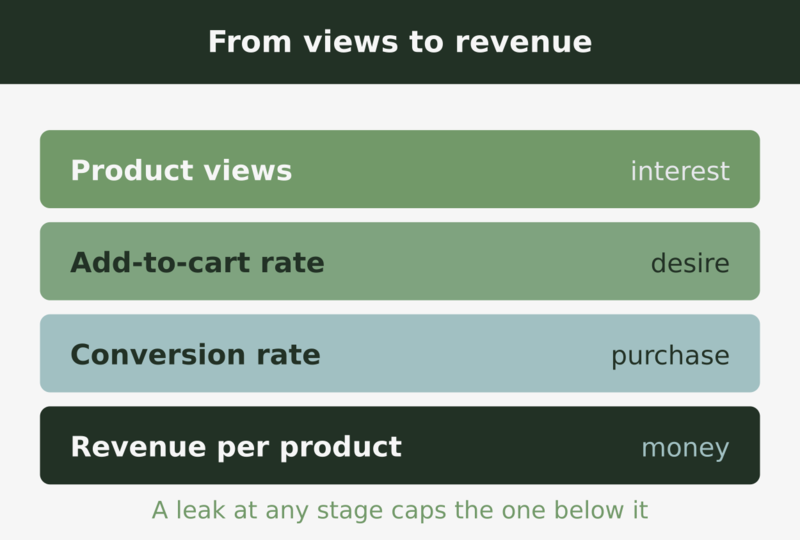
Your store-wide conversion rate and revenue are useful headlines. But they’re averages, and averages lie. A 2.5% store conversion rate might be hiding a hero product converting at 8% and a dozen duds converting at 0.3%.
When you zoom in to the product and category level, you stop guessing. You can answer real questions:
- Which products bring traffic but fail to convert?
- Which categories generate the most profit, not just the most revenue?
- Which items get added to carts but rarely purchased?
- Where should your next photography, copywriting, or ad budget go?
This is where merchandising stops being art and starts being data. And it connects directly to e-commerce analytics fundamentals—you can’t analyze what you don’t track properly.
The Core Product Performance Metrics
Let’s break down the numbers worth tracking for every product. You don’t need all of them on day one, but each answers a different question.
| Metric | What it answers |
|---|---|
| Product views | How much interest does this item attract? |
| Add-to-cart rate | Of people who view it, how many want it? |
| Product conversion rate | Of viewers, how many actually buy? |
| Cart-to-purchase rate | Once added, how often does it sell? |
| Revenue per product | Total money this item brings in |
| Gross margin per product | Money left after cost of goods |
| Return rate | How often it comes back |
Notice that revenue is only one row. A product can be a revenue star and a margin disaster if it’s discounted to death or returned constantly. That’s why margin and returns belong on the list too.
The Four Product Quadrants
Here’s a simple mental model I use. Plot every product on two axes: traffic (how many people view it) and conversion (how well it sells). You get four quadrants, and each one calls for a different move.
High traffic, high conversion — your heroes
These products work. Protect them. Make sure they’re never out of stock, feature them prominently, and consider building bundles or upsells around them.
High traffic, low conversion — the leaky buckets
This is where the gold is. People are interested, but something stops them from buying. Maybe the price is wrong, the photos are weak, the description is thin, or reviews are missing. Fixing one of these can unlock meaningful revenue, since the traffic is already there. Our product page optimization guide walks through exactly what to test here.
Low traffic, high conversion — the hidden gems
These products sell well when people find them—but not enough people do. The fix is visibility: better internal placement, category promotion, search optimization, or a slot in your email campaigns. A little exposure can turn these into heroes.
Low traffic, low conversion — the dead weight
Nobody looks, and the few who do don’t buy. Be honest about these. Some deserve a final markdown to clear inventory. Others should simply be retired. Holding dead stock ties up cash and clutters your catalog.
One important note: when you remove a product page for good, don’t just let it 404. Redirect it to the most relevant category or replacement product so you keep any link equity and don’t strand shoppers on a dead end.
Analyzing Category Performance
Zoom out one level and the same logic applies to categories. Group your products and compare categories on revenue, margin, and conversion. You’ll usually find that revenue and profit don’t line up the way you expect.
A classic example: a high-volume, low-margin category like accessories might generate impressive revenue but thin profit. Meanwhile a quiet, high-margin category could be your real engine. Looking only at revenue would have you investing in the wrong place.
Useful category-level questions to ask:
- Which category has the best margin per visitor?
- Which category page converts visitors into product views?
- Which categories are growing or shrinking over time?
- Do certain categories drive larger average baskets?
That last point ties back to basket size—strong categories often pull up your overall average order value, which makes them worth doubling down on.
The 80/20 Reality of Most Catalogs
In nearly every store I’ve worked with, a small slice of products drives the majority of revenue. The Pareto principle shows up again and again: roughly 20% of products produce around 80% of the sales.
A handful of products carry the store. The rest are along for the ride—and some are dragging it down.
That’s not a problem to fix; it’s a reality to manage. Your job is to know which products are in your vital 20%, defend them fiercely, and make clear-eyed decisions about the long tail. Some of that tail is worth keeping for selection and SEO. Some is just clutter.
A Simple Monthly Review Process
You don’t need fancy software to start. Here’s a process you can run once a month with a spreadsheet export.
- Pull product-level data: views, add-to-carts, orders, revenue, and cost if you have it
- Calculate add-to-cart rate and conversion rate per product
- Sort by revenue to confirm your top earners
- Flag high-traffic, low-conversion products for optimization
- Flag low-traffic, high-conversion products for more visibility
- Build a clearance or retirement list from the dead weight
- Pick three actions for the month and ignore the rest
That last step matters. The point of analysis is action, not admiration. Three focused changes a month beat a beautiful report nobody acts on.
Common Pitfalls
Judging too soon. A product with 30 views hasn’t proven anything yet. Wait for a reasonable sample before declaring a winner or a loser.
Ignoring seasonality. A garden product looks like dead weight in December and a hero in May. Compare like with like.
Optimizing for revenue alone. Always keep margin in view. The biggest-revenue product isn’t always the most valuable one.
Frequently Asked Questions
How many products do I need before analysis is worth it?
Even with 20 products it’s useful, because you’ll spot your leaky buckets and hidden gems. The bigger your catalog, the more the analysis pays off.
What’s the single most useful product metric?
If I had to pick one, it’s the combination of traffic and conversion—the quadrant view. It tells you not just how a product is doing but what to do about it.
Key Takeaways
- Store-wide averages hide your real winners and losers—go product by product
- Track views, add-to-cart rate, conversion, revenue, and margin together
- The traffic-vs-conversion quadrant tells you exactly what action each product needs
- High-traffic, low-conversion products are your biggest opportunity
- Roughly 20% of products drive most revenue—know which ones and protect them
- Always redirect retired product pages instead of leaving dead links
Product performance analysis turns your catalog from a static list into a managed portfolio. Run it monthly, act on three things at a time, and your best products will keep getting better while the dead weight stops dragging you down.
Keep reading: return rate analytics: measure returns and cut the avoidable ones.

Sophie Andersson
Technical marketer with 7+ years in e-commerce growth teams. Started as a developer, moved into marketing, and now lives at the intersection of both worlds. Believes that good analytics shouldn't require a PhD to understand.
More about me →