Checkout Funnel Drop-Off: How to Find Where You Lose Buyers
 Sophie Andersson
·
·
6 min read
Sophie Andersson
·
·
6 min read

You know roughly 70% of carts get abandoned. You’ve read the tips. But here’s the question almost nobody can answer precisely: where exactly do your customers drop off? At the shipping step? The payment screen? The moment they see the total?
Knowing your overall checkout abandonment rate is like knowing your car gets bad mileage without knowing why. Measuring drop-off step by step is how you pop the hood. It turns a vague problem into a specific, fixable one.
In this guide, I’ll walk you through how to map your checkout as a funnel, measure the drop-off at each step, and read the numbers to find where you’re actually leaking money.
Checkout Is a Funnel, Not a Single Event
Most analytics setups treat checkout as one thing: someone either completes an order or they don’t. That’s a missed opportunity. Checkout is a sequence of steps, and customers leak out at every one.
A typical multi-step checkout looks something like this:
- Cart viewed
- Checkout started
- Contact or account step completed
- Shipping details and method selected
- Payment information entered
- Order confirmed
When you measure the percentage of people who move from each step to the next, you get a step-by-step picture of where intent dies. That’s the difference between “checkout converts at 30%” and “we lose 22% of people at the shipping step.” Only one of those tells you what to fix.
Why Overall Abandonment Rate Isn’t Enough
Here’s the thing about a single abandonment number: it’s a symptom, not a diagnosis. Two stores can both have a 70% abandonment rate for completely different reasons.
Store A loses most people on the first checkout screen because they force account creation. Store B gets people all the way to payment and then loses them to a surprise shipping fee. Same headline number, totally different fixes. Step-level measurement is the only way to tell them apart.
This is also where checkout measurement connects to the broader picture. Understanding the reasons people leave is covered in our guide on cart abandonment reasons and fixes. Measuring where they leave is what this guide adds on top.
How to Set Up Step Tracking
To measure step drop-off, you need to fire an event each time a shopper reaches a checkout stage. Most analytics platforms have standard e-commerce events for exactly this:
| Checkout stage | Typical event name |
|---|---|
| Cart viewed | view_cart |
| Checkout started | begin_checkout |
| Shipping info added | add_shipping_info |
| Payment info added | add_payment_info |
| Order placed | purchase |
If your checkout has custom steps, add custom events for them. The goal is one clean event per meaningful stage, fired exactly once when the shopper reaches it. For the full picture of how to structure these events, see our e-commerce event tracking schema.
One practical tip: fire the event when the step loads, not when the button is clicked. You want to count everyone who arrived at a step, including those who arrived and then bailed.
Reading the Drop-Off Numbers
Once events are firing, build a funnel report and look at two things at every step: the conversion from the previous step, and the absolute number of people lost.
Here’s an illustrative funnel to show how to read it:
| Step | Shoppers | Step conversion |
|---|---|---|
| Checkout started | 1,000 | — |
| Contact completed | 820 | 82% |
| Shipping completed | 620 | 76% |
| Payment entered | 560 | 90% |
| Order confirmed | 500 | 89% |
Look at the shipping step: only 76% of people made it through, the worst leak in the funnel. That’s where you’d focus. Maybe shipping costs feel high, the options are confusing, or delivery dates are too far out. The numbers don’t tell you the why—but they point your investigation at the right step instead of wasting effort polishing the payment screen, which is already converting at 90%.
The two questions to ask at each step:
- Where is the biggest percentage drop? That’s your friction point.
- Where do you lose the most people in absolute terms? Sometimes a smaller percentage drop on a high-traffic step costs you more orders than a bigger drop later.
Segment Your Funnel for Real Insight
A blended funnel is a fine start, but the real insights come from segmenting. The same checkout often performs very differently across groups.
- Device: Mobile checkout almost always leaks more than desktop. If your mobile shipping step drops 40% while desktop drops 15%, you’ve found a mobile UX problem.
- New vs returning: First-time buyers face more friction—they’re entering everything fresh. Big gaps here often point to account or form issues.
- Traffic source: Paid traffic sometimes converts differently than organic, hinting at expectation mismatches from your ads.
Segmenting turns “we lose people at shipping” into “we lose mobile first-time buyers at shipping,” which is a far easier problem to solve. This pairs naturally with behavioral segmentation.
From Diagnosis to Fix
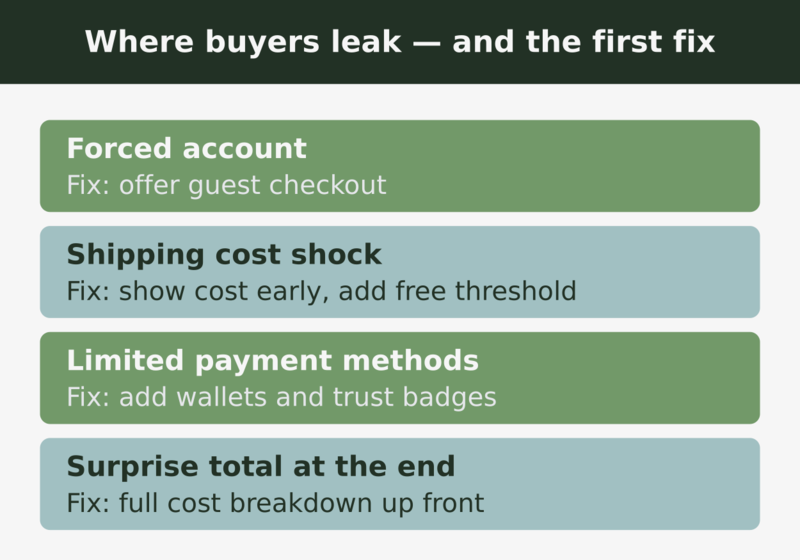
Once you know where the leak is, the fix usually falls into one of these buckets. Match the step to the likely cause:
| Leaky step | Likely culprit | First thing to try |
|---|---|---|
| Contact / account | Forced registration | Offer guest checkout |
| Shipping | Cost or speed shock | Show shipping earlier; add a free threshold |
| Payment | Limited methods or trust doubts | Add wallets; show security badges |
| Final confirm | Surprise total or second thoughts | Show full cost breakdown up front |
Then test the change and watch that step’s conversion. This is exactly the kind of thing worth running as a controlled experiment—our A/B testing guide covers how to do it without fooling yourself with noise. For the full menu of checkout fixes, the checkout optimization guide has 17 tactics to draw from.
You can’t fix a leak you can’t locate. Measure the step, then change one thing at a time.
Common Tracking Mistakes
Firing events on the wrong trigger. If you fire on button click instead of step load, you undercount the people who reached a step and left—exactly the people you’re trying to find.
Double-firing. If a step reloads and fires its event twice, your funnel math breaks. Make events fire once per session per step.
Ignoring single-page checkouts. If your whole checkout is one page, you can still track field interactions or section visibility to approximate steps. You’re not off the hook just because there are no page loads.
Frequently Asked Questions
How many checkout steps should I track?
Track every meaningful stage your shopper passes through. For most stores that’s four to six events from cart to confirmation. More granular is fine if your checkout is complex.
What’s a good step conversion rate?
There’s no universal number—it depends on your audience and product. The useful comparison is your own funnel over time and across segments. A step that’s clearly worse than its neighbors is your target.
Key Takeaways
- Treat checkout as a funnel, not a single pass/fail event
- Fire one clean event per checkout step, on step load not button click
- Find the biggest percentage drop and the biggest absolute loss—they can be different steps
- Segment by device, new vs returning, and source for real insight
- Match the leaky step to its likely cause, then test one fix at a time
Step-level checkout measurement is the difference between guessing and knowing. Map your funnel, watch where people leave, and you’ll spend your time fixing the leak that’s actually costing you orders—not the one that just feels broken.

Sophie Andersson
Technical marketer with 7+ years in e-commerce growth teams. Started as a developer, moved into marketing, and now lives at the intersection of both worlds. Believes that good analytics shouldn't require a PhD to understand.
More about me →