You have traffic. You have sales. But when someone asks “what should we focus on to grow?” — the answer gets fuzzy.
Here is the thing: most online stores collect data. Very few actually use it to make decisions. They have dashboards full of numbers, but no clear idea which numbers matter.
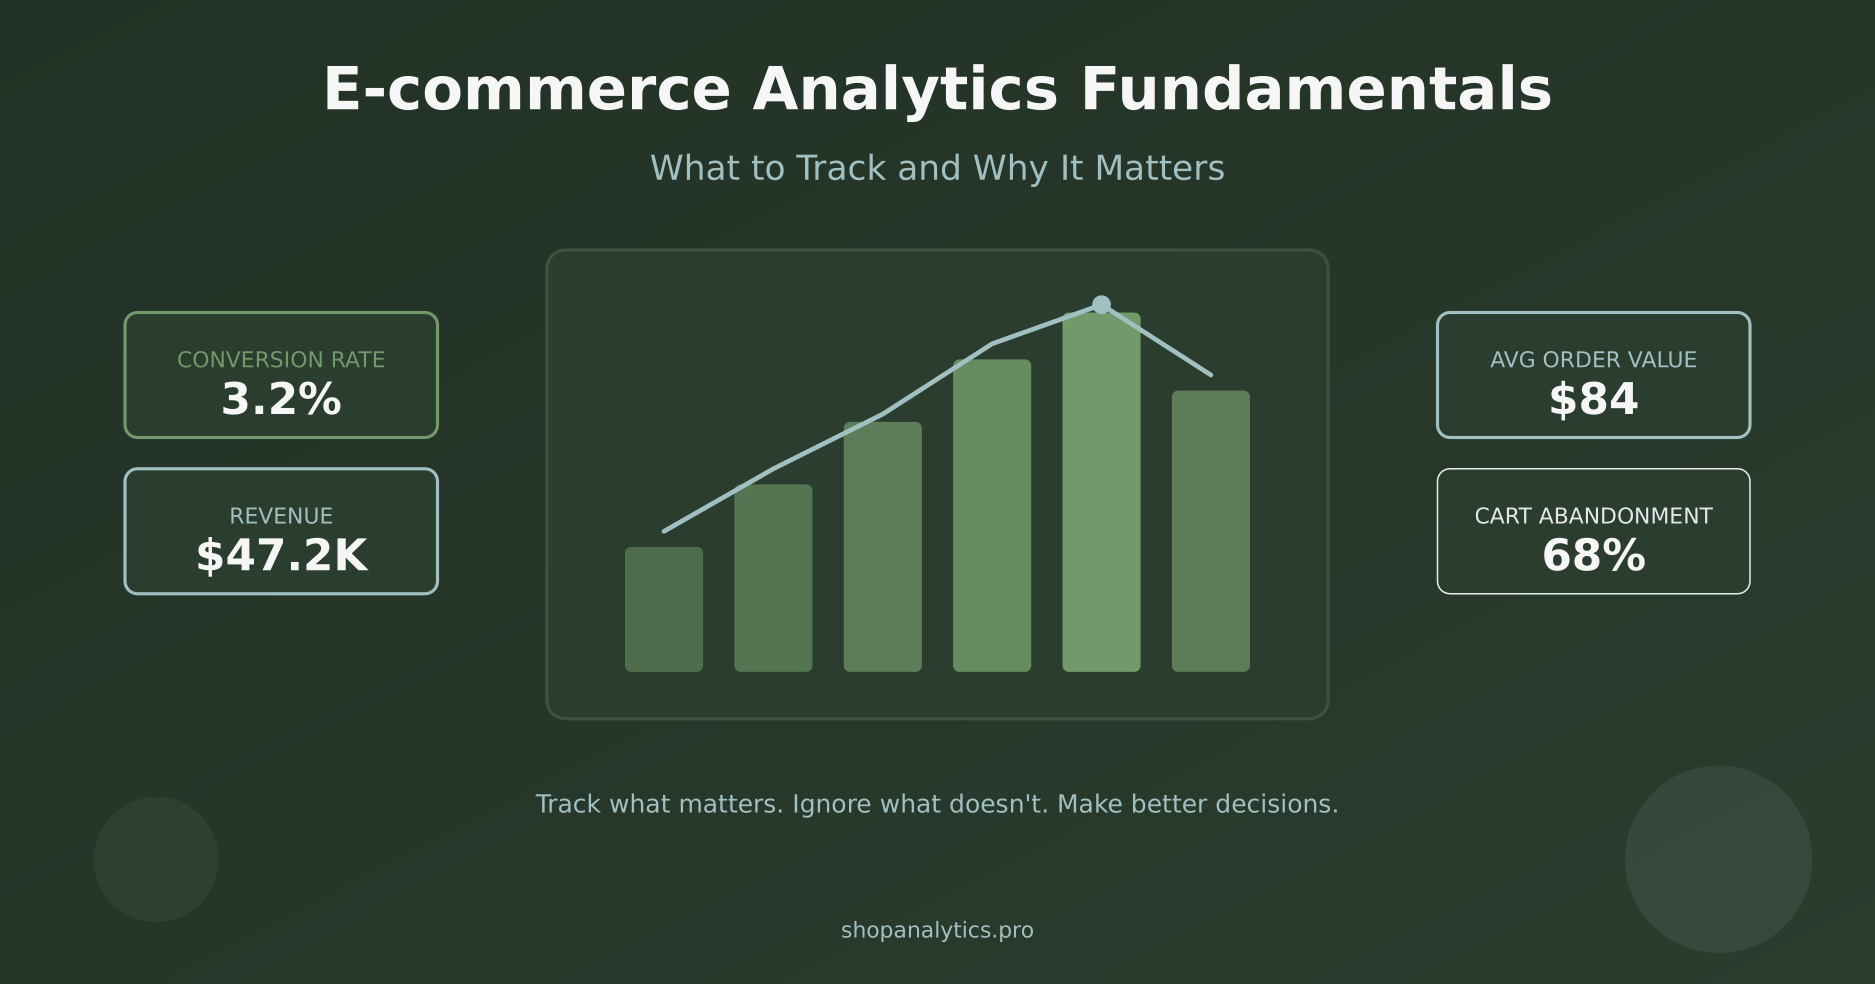
This guide covers e-commerce analytics fundamentals — what to track, why it matters, and how to turn data into action. No specific tools required. These principles work whether you are using a free solution or an enterprise platform.
Let us build your analytics foundation from the ground up.

Why Most E-commerce Analytics Fails
Before we talk about what to track, let us understand why analytics often does not work.
The problem is not lack of data. It is the opposite — too much data, poorly organized, with no connection to decisions.
I have seen stores tracking 200+ events but unable to answer basic questions like “why did sales drop last week?” They have data everywhere but insights nowhere.
Common symptoms of broken analytics:
- Dashboard fatigue — Reports that nobody looks at after the first week
- Metric overload — Tracking everything “just in case” but using nothing
- Vanity focus — Celebrating pageviews while conversion tanks
- Analysis paralysis — So much data that no decisions get made
- Trust issues — Numbers that do not match between reports
The fix is not more data. It is better data — fewer metrics, clearly defined, directly connected to actions you can take.
The Analytics Pyramid: Not All Metrics Are Equal
Think of metrics in three layers. At the bottom are vanity metrics — easy to measure but hard to act on. At the top are revenue metrics — the ones that directly impact your business.
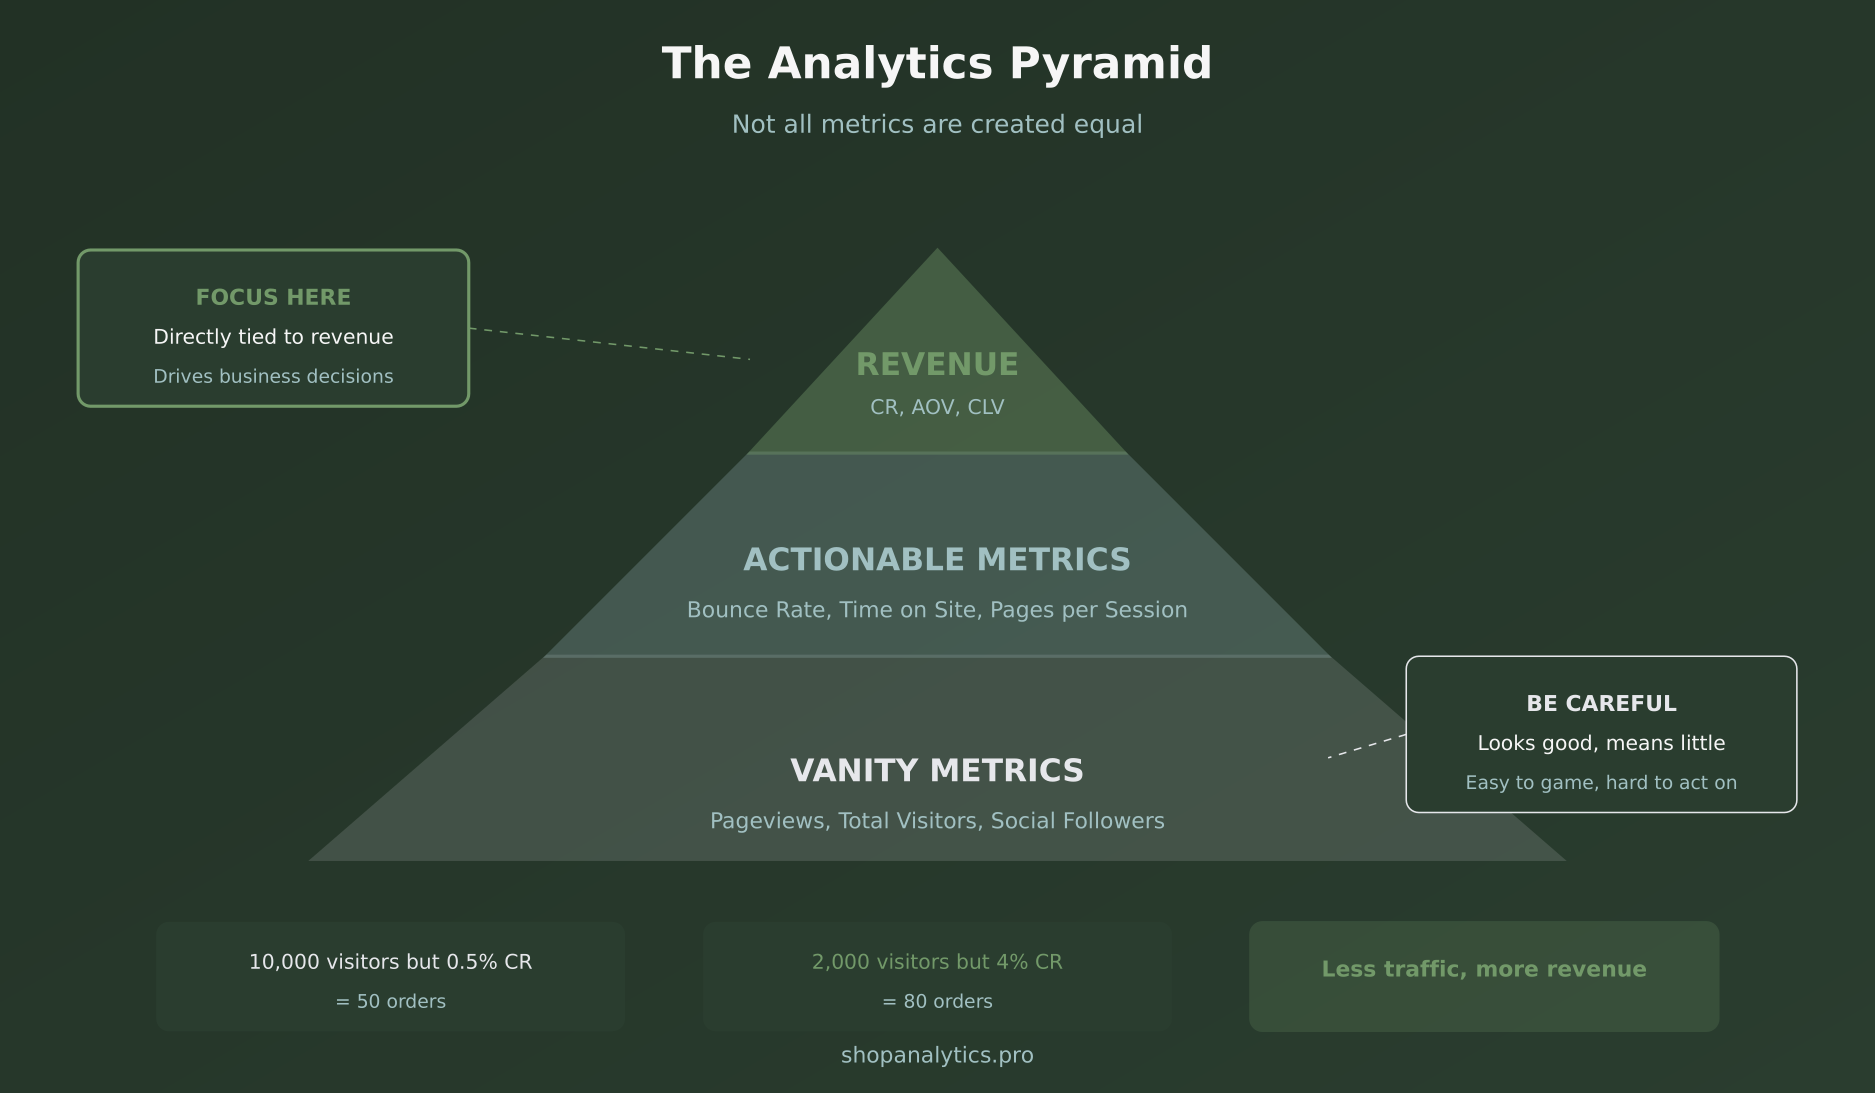
Vanity Metrics (Bottom Layer)
These look impressive in reports but rarely drive decisions:
- Total pageviews
- Total visitors
- Social media followers
- Email list size (without engagement)
The problem? You can have 100,000 visitors and still go bankrupt. These metrics tell you something is happening, but not whether it is good or bad.
Actionable Metrics (Middle Layer)
These help you understand behavior and identify problems:
- Bounce rate by page
- Time on site
- Pages per session
- Exit pages
Better, but still one step removed from revenue. A high bounce rate might indicate a problem — or it might be perfectly fine for certain pages.
Revenue Metrics (Top Layer)
These directly connect to money in the bank:
- Conversion rate
- Average order value
- Customer lifetime value
- Revenue per visitor
This is where you should focus. Every other metric should ultimately connect back to these.
What to Track at Each Stage of the Customer Journey
Your customers do not jump straight from “never heard of you” to “purchased.” They move through stages, and each stage has different metrics that matter.
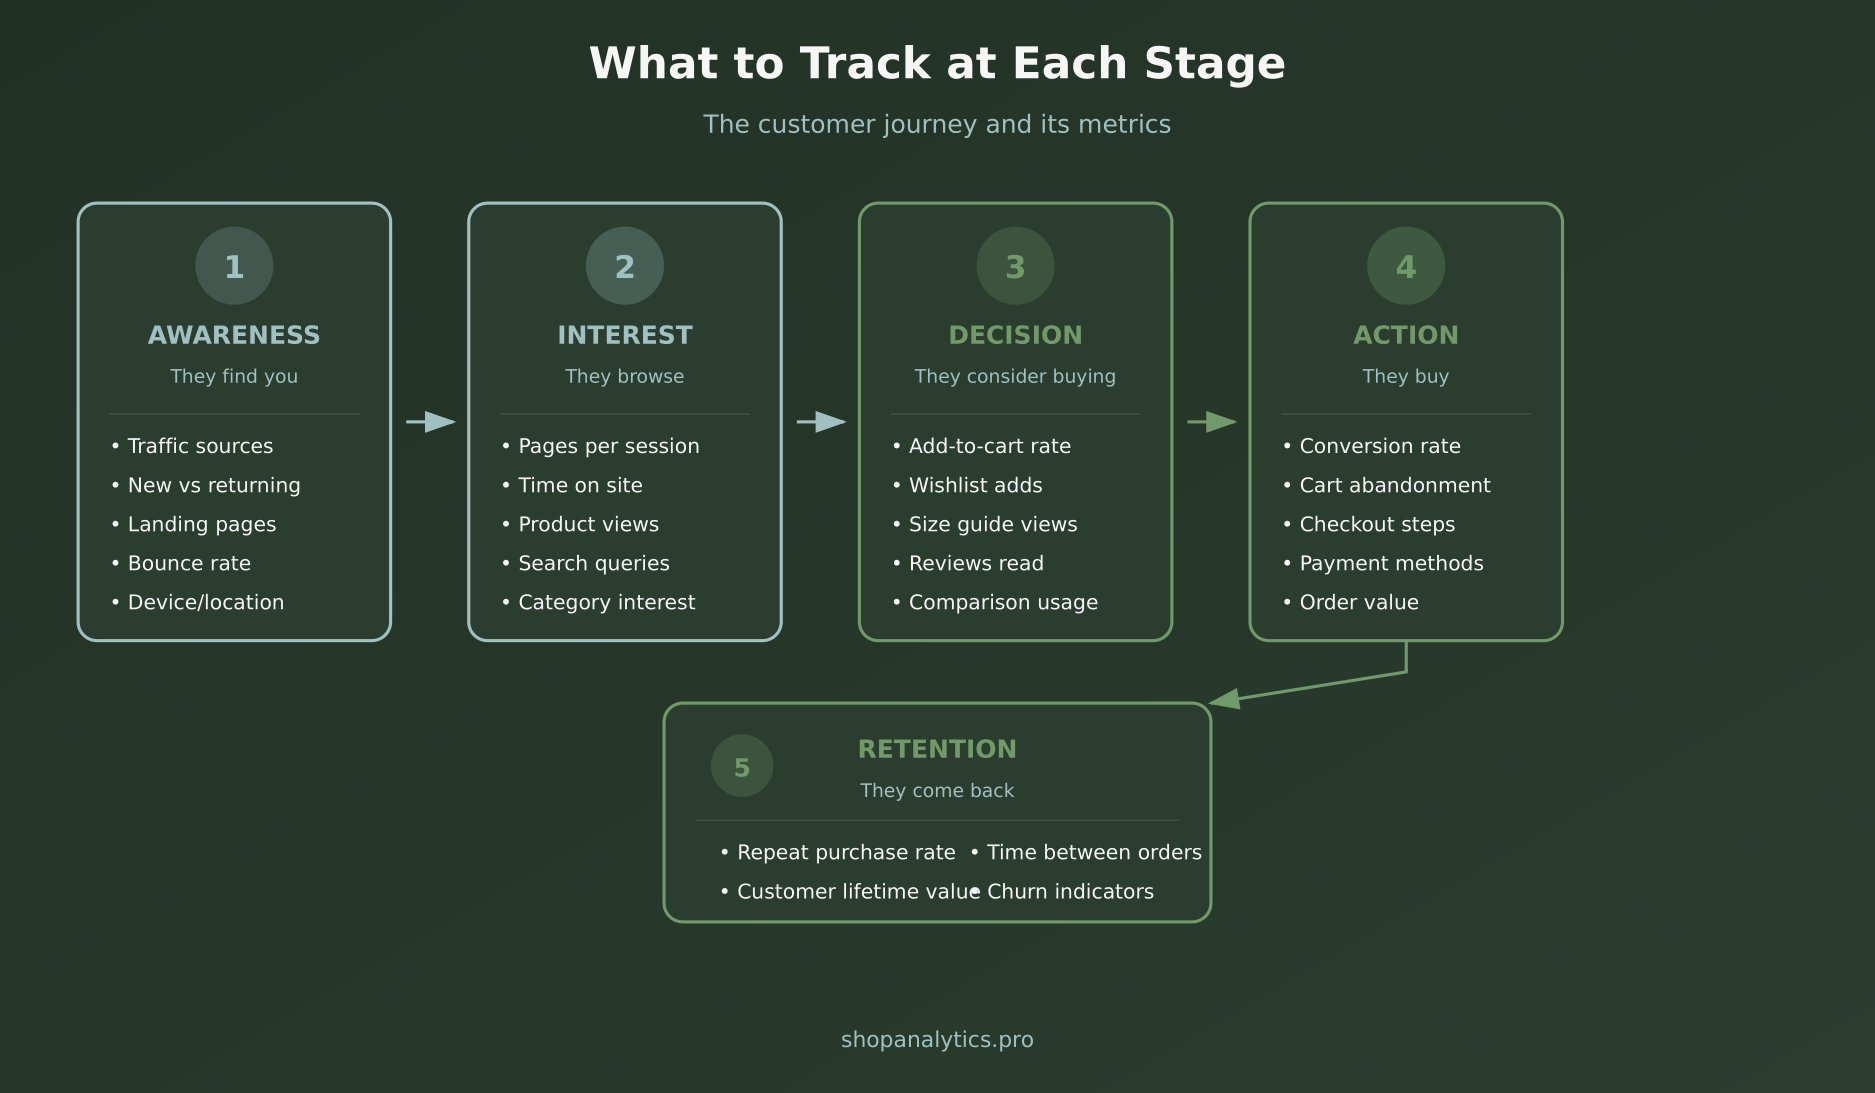
Stage 1: Awareness
They find you. The question is: how, and are they the right people?
Key metrics:
- Traffic by source — Where visitors come from (organic, paid, social, direct)
- New vs returning visitors — Are you attracting new customers or just the same people?
- Landing page performance — Which pages attract visitors and do they stay? (Our landing page classifier helps categorize your URLs by page type for cleaner analysis.)
- Bounce rate by source — Are certain channels sending unqualified traffic?
Stage 2: Interest
They browse. Now you need to know: are they engaged or just clicking around?
Key metrics:
- Pages per session — How deep do they explore?
- Product page views — Which products get attention?
- Search queries — What are people looking for?
- Category engagement — Which collections resonate?
Stage 3: Decision
They consider buying. This is where intent signals appear.
Key metrics:
- Add-to-cart rate — What percentage of product views become cart additions?
- Wishlist additions — Interest without urgency
- Size guide views — Buying signals in apparel
- Review engagement — Are they reading social proof?
For a deeper dive into decision-stage signals, see our guide on micro-conversions in e-commerce.
Stage 4: Action
They buy (or do not). This is where revenue happens.
Key metrics:
- Conversion rate — The percentage who complete a purchase
- Cart abandonment rate — How many start but do not finish?
- Checkout step completion — Where exactly do people drop off?
- Average order value — How much per transaction?
Stage 5: Retention
They come back (or do not). This is where profitability lives.
Key metrics:
- Repeat purchase rate — What percentage buy again?
- Customer lifetime value — Total expected revenue per customer
- Time between purchases — How often do they return?
- Churn indicators — Signs someone will not come back
The 7 Essential E-commerce Metrics
If you track nothing else, track these seven. They cover the full picture of your store’s health.
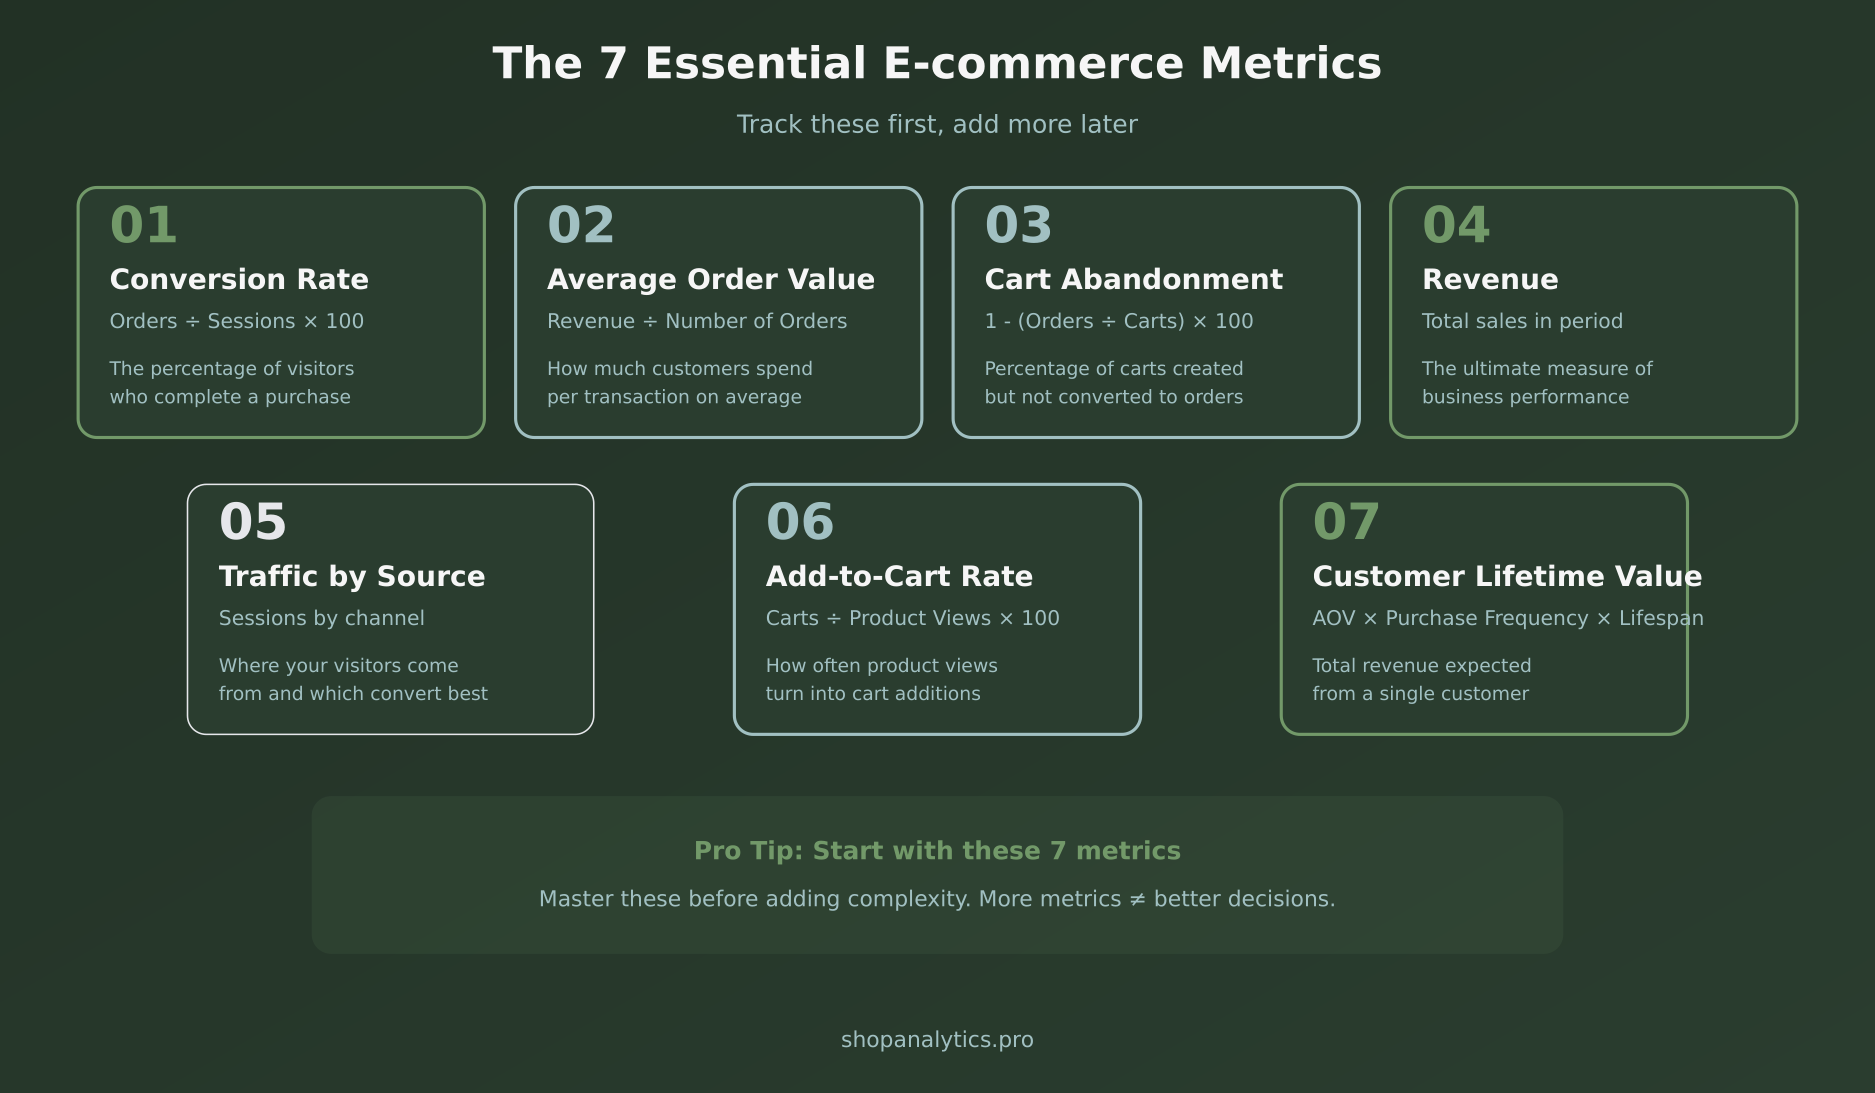
1. Conversion Rate
What it is: Orders divided by sessions, multiplied by 100.
Why it matters: This is the single most important metric for most stores. A small improvement here multiplies everything else.
Typical range: 1-4% for most e-commerce stores. Higher for niche stores with qualified traffic.
2. Average Order Value (AOV)
What it is: Total revenue divided by number of orders.
Why it matters: Increasing AOV is often easier than increasing conversion rate. If customers are already buying, help them buy more.
How to improve: Bundles, upsells, cross-sells, free shipping thresholds.
3. Cart Abandonment Rate
What it is: Percentage of carts that do not convert to orders.
Why it matters: These people wanted to buy. Something stopped them. Finding out what is often the fastest path to more revenue.
Typical range: 60-80% is normal. Under 60% is excellent.
4. Revenue
What it is: Total sales in a given period.
Why it matters: The ultimate measure. Everything else should connect back to this.
Track it by: Day, week, month, and compare year-over-year to account for seasonality.
5. Traffic by Source
What it is: Where your visitors come from — organic search, paid ads, social, email, direct.
Why it matters: Not all traffic is equal. Knowing which sources convert helps you invest wisely.
Key insight: Track conversion rate by source, not just volume.
6. Add-to-Cart Rate
What it is: Cart additions divided by product page views.
Why it matters: This bridges the gap between interest and purchase intent. Low add-to-cart suggests product page problems.
Typical range: 5-15% depending on industry and price point.
7. Customer Lifetime Value (CLV)
What it is: Average order value × purchase frequency × customer lifespan.
Why it matters: Acquiring customers costs money. Knowing their long-term value helps you spend wisely on acquisition.
Key insight: If CLV is high, you can afford to spend more on acquisition. If it is low, focus on retention. To figure out exactly how much you can spend per customer, try our break-even CPA calculator — it factors in your AOV, margins, and conversion rate to set profitable acquisition limits.
Building Your Measurement Framework
Metrics alone are not enough. You need a framework that connects them to decisions.
Here is a simple approach:
Step 1: Define Your Business Questions
Start with what you need to know, not what you can measure. Good questions:
- Where are we losing customers in the funnel?
- Which traffic sources bring buyers, not just visitors?
- What makes customers come back?
- Which products drive the most revenue? (Our merchandising dashboard answers this one instantly.)
Step 2: Map Metrics to Questions
For each question, identify which metrics provide the answer:
- “Where are we losing customers?” → Funnel drop-off rates by stage
- “Which sources bring buyers?” → Conversion rate by traffic source
- “What makes customers return?” → Repeat purchase rate, time between orders
Step 3: Connect Metrics to Actions
Every metric should have a “so what” — an action you would take if the number changes:
- Cart abandonment up → Review checkout friction, test interventions
- AOV down → Test bundles, upsells, free shipping threshold
- Traffic up but revenue flat → Investigate traffic quality by source
If you cannot define the action, question whether you need the metric.
Analytics Setup Checklist
Use this checklist when setting up or auditing your analytics:
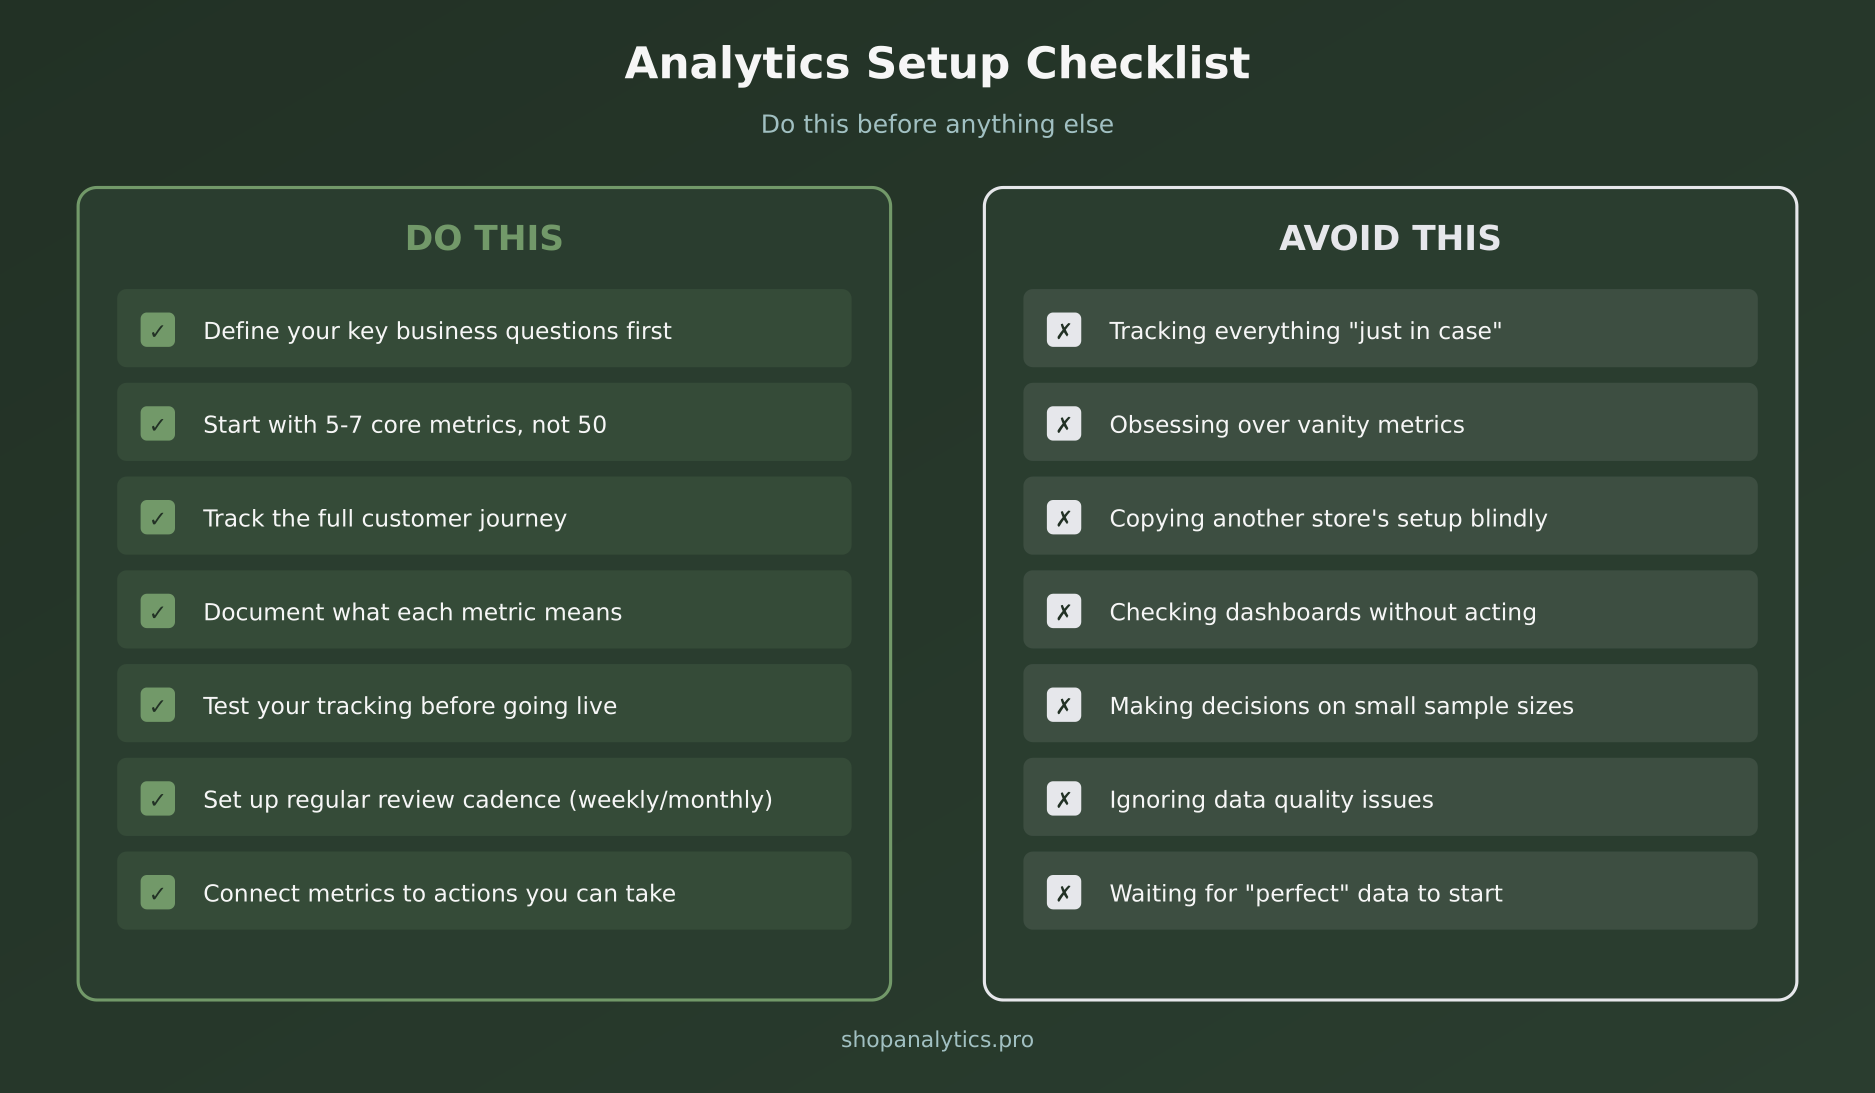
Do This
- Define your key business questions first
- Start with 5-7 core metrics, not 50
- Track the full customer journey
- Document what each metric means and how it is calculated
- Test your tracking before going live
- Set up regular review cadence (weekly or monthly)
- Connect every metric to an action you can take
Avoid This
- Tracking everything “just in case”
- Obsessing over vanity metrics
- Copying another store’s setup blindly
- Checking dashboards without acting on insights
- Making decisions based on small sample sizes
- Ignoring data quality issues
- Waiting for “perfect” data to start analyzing
Common Questions About E-commerce Analytics
How often should I check my analytics?
Daily checks create noise. Weekly reviews catch trends. Monthly deep-dives find patterns. Start with weekly reviews of your core 7 metrics, with monthly sessions to dig deeper.
What is a good conversion rate?
The average is 1-3%. But “good” depends on your business. A 1% rate for high-ticket items might be excellent. A 5% rate for impulse purchases might be low. Compare against your own history, not industry benchmarks.
Should I track everything from day one?
No. Start with the essentials and add complexity as needed. It is easier to add tracking later than to clean up a messy implementation. Get the basics right first.
My numbers do not match between reports. What is wrong?
Common causes: different date ranges, different definitions (sessions vs users), tracking gaps, ad blockers. Pick one source of truth for each metric and document how it is calculated.
Key Takeaways
Let me wrap this up with what matters most:
- Less is more — Start with 7 core metrics. Master those before adding complexity.
- Focus on revenue metrics — Vanity metrics feel good but do not pay bills.
- Track the full journey — From awareness to retention, each stage has different metrics.
- Connect metrics to actions — If you cannot act on it, why track it?
- Review regularly — Data without review is just storage.
Good e-commerce analytics is not about having the most data. It is about having the right data and actually using it to make better decisions.
Start simple. Get the fundamentals right. Build from there.
Ready to go deeper? Learn how to capture specific buying signals in our guide to e-commerce event tracking.